Introduction
For years, advertisers using Google’s Performance Max (PMax) campaigns have wanted more transparency. While the benefits of automation and broad reach across Google’s properties are clear, the lack of visibility into how each individual channel contributes to campaign performance has been a major pain point.
That’s changing with Google’s latest update: Performance Max Channel Reporting. This powerful new feature gives advertisers a clearer view into how their campaigns perform across different Google platforms like Search, YouTube, Display, Gmail, Discover, and Maps. In this blog post, we’ll break down what this new reporting offers, how you can access it, and how it can help you better pmax optimize your campaigns in 2025.
What Is Performance Max Channel Reporting?
Performance Max is already known for leveraging real-time bidding and automation to show your ads across all of Google’s networks. However, it traditionally operated like a black box—advertisers could see aggregated results, but not the specifics of where and how ads were being served.
With the new Performance Max Channel Reporting, advertisers now have access to detailed insights that break down performance by individual channel and ad format. This level of granularity can help you make smarter creative, budget, and bidding decisions.
Where to Find the Channel Performance Report
To access the new reporting feature, follow these steps inside your Google Ads account:
- Navigate to your Campaigns
- Select your PMax campaign
- Click on Insights & Reports
- Choose Channel Performance
Once there, you’ll be presented with a range of useful views including:
- A high-level performance summary
- A channel-to-goals visualization
- A detailed table breaking down metrics by each Google channel
These tools are designed to help you quickly understand which parts of your campaign are driving results and which ones may need adjustments.
Exploring the Reports and Visualizations
The Channel Performance page is more than just a dashboard. It offers an in-depth look into how your ads are performing across different formats and Google properties. Here are the key areas to pay attention to:
Ad Format Views
Every channel behaves differently when it comes to creative. For instance, a video ad might perform exceptionally well on YouTube but fall short on Display. The ad format view lets you compare performance across different creative types so you can better allocate media spend and refine your content strategy.
This feature is particularly helpful when trying to pmax optimize your campaign. By understanding which ad formats are performing best on which channels, you can shift your creative resources accordingly to maximize impact. For example, leveraging Display Advertising strategies can help enhance your campaign’s effectiveness.
Product-Driven Insights
For ecommerce businesses using product feeds, this part of the report is a game-changer. You’ll get visibility into how Shopping ads are performing not just on Search, but also as dynamic remarketing ads on Display.
This can help you identify which products are gaining traction and which ones may need pricing or listing improvements. It also helps in refining product segmentation strategies to better align with channel-specific behaviors. Tools such as Ecommerce Marketing can further support these efforts.
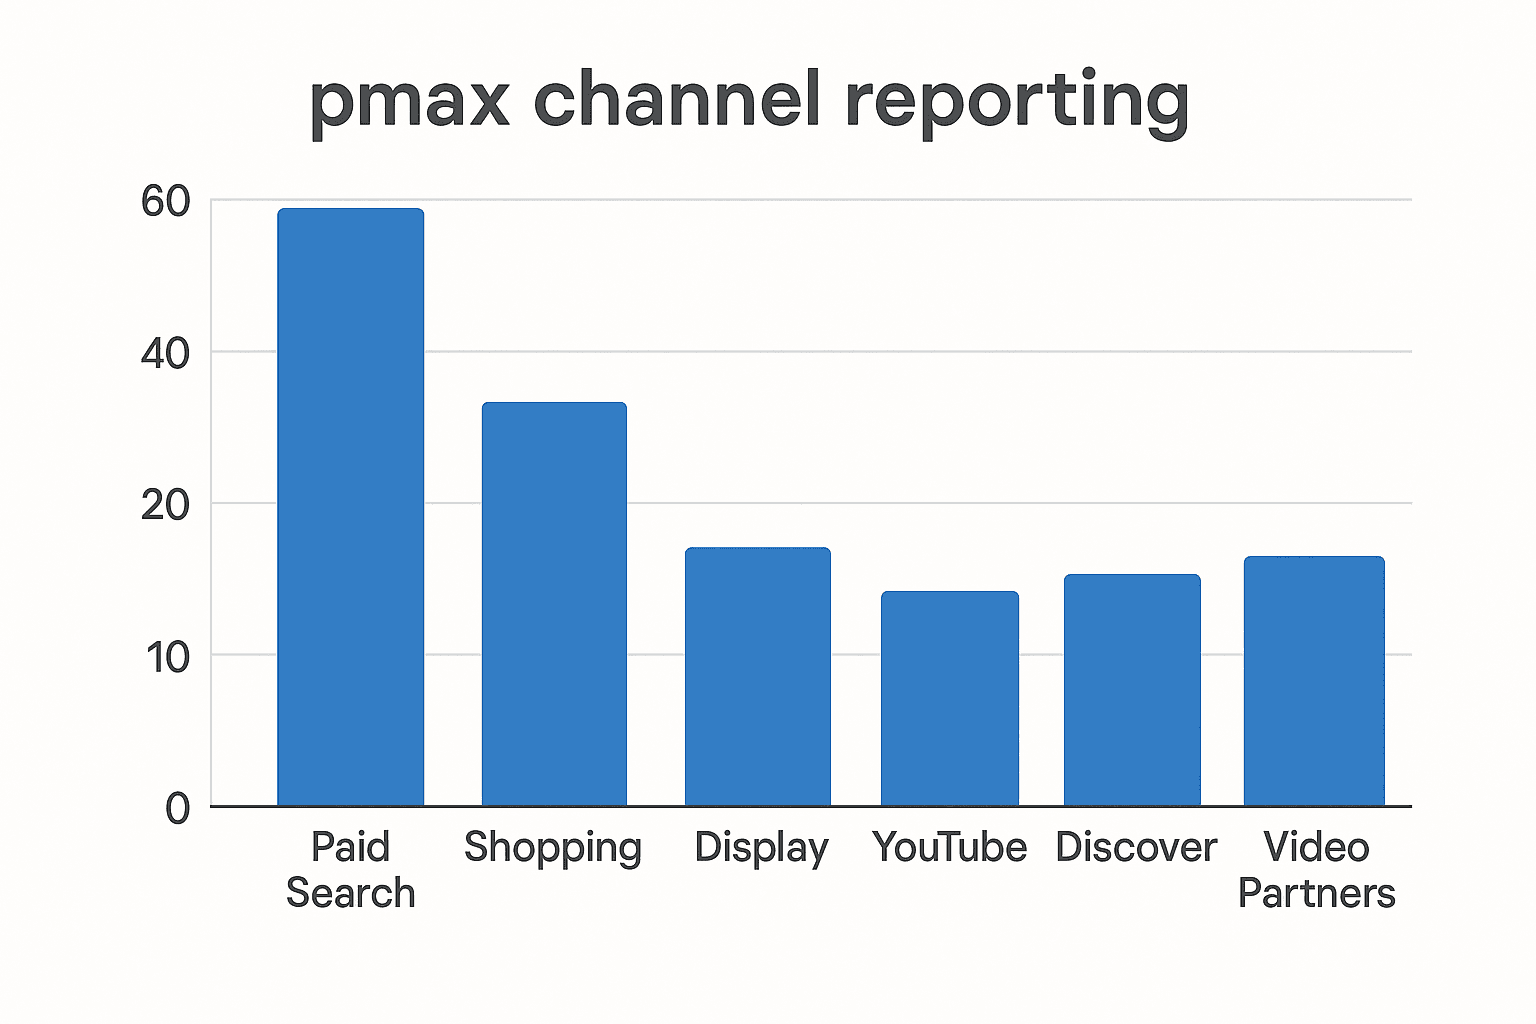
Channel Distribution Table
Arguably the most detailed part of the report, this table provides metrics like impressions, clicks, conversions, CPA, ROAS, and cost for each channel. You can also customize columns to focus on the KPIs that matter most to your business.
The ability to download and share this table makes it ideal for internal reviews or client reporting. It introduces a new level of transparency that was missing from PMax campaigns in the past. Leveraging Data Security Compliance ensures your data remains protected while optimizing campaigns.
Status Column and Diagnostics
The status column acts like a built-in troubleshooting assistant. It flags issues such as underperforming ad formats or problems with ad delivery. This allows you to proactively address problems before they impact your overall campaign results.
This feature is particularly useful for advertisers managing multiple campaigns, as it cuts down on guesswork and streamlines the optimization process. Utilizing Remarketing strategies can help re-engage potential customers identified through these diagnostics.
The Importance of Cross-Channel Measurement
One of the biggest takeaways from this new reporting feature is understanding that Performance Max is not about optimizing for individual channels—it’s about optimizing for outcomes. Because PMax uses Google’s AI to bid for conversions across all channels simultaneously, looking at any single channel’s CPA or ROAS in isolation can be misleading.
Instead of focusing on channel-level metrics, Google encourages advertisers to look at how all channels work together to achieve your overall marketing goals. This holistic view is crucial when trying to pmax optimize your campaigns, as it ensures you’re not making decisions based on incomplete data. Incorporating Programmatic advertising can further enhance cross-channel strategies.
How to Use the Report to PMax Optimize Your Campaigns
Now that you know what the report includes, here’s how to use it to your advantage:
-
Align With Your Goals: Use the channel-to-goal visualizations to see which platforms are contributing most to specific objectives like sales or leads.
-
Adjust Creative Strategy: If video ads are outperforming product ads on YouTube, consider allocating more budget to video production or testing new creative formats. Exploring Content Marketing can provide additional creative ideas.
-
Budget Reallocation: Use the Channel Distribution Table to identify high-ROAS channels and shift budget away from underperforming ones.
-
Fix Issues Quickly: Regularly check the diagnostics and status columns to troubleshoot problems early.
-
Report With Clarity: Use downloadable tables and visualizations to create clear, data-driven presentations for stakeholders or clients.
-
Experiment and Iterate: Leverage insights to run A/B tests on different creative or audience segments, and use the results to further refine your approach. Implementing SEO Thailand techniques can complement your paid strategies.
Final Thoughts and Conclusion
Google’s new Performance Max Channel Reporting is a major step forward in campaign transparency. While it doesn’t change how PMax operates behind the scenes, it offers advertisers a much-needed look into the mechanics of their campaigns. By breaking down performance by channel and format, you can now make more informed decisions to guide your creative, budgeting, and bidding strategies.
Whether you’re managing a large ecommerce operation or running local service ads, the ability to pmax optimize using detailed channel data is a welcome update. It allows you to move beyond surface-level metrics and get a clearer picture of what’s really working.
In 2025 and beyond, as Google continues to evolve its advertising products, tools like this will become increasingly essential. So take the time to explore the new features, dig into your data, and start making smarter, more strategic decisions with your Performance Max campaigns. For expert guidance, consider reaching out to Agencies specializing in digital marketing.