
If you’ve noticed your Google Ads budget not going as far as it used to, you’re not imagining it. The average cost-per-click jumped from $4.66 to $5.42 in a single year, hitting advertisers across nearly every industry. That’s a real shift, and it’s backed by benchmark data from more than 16,000 campaigns analyzed by WordStream by LocaliQ.
Here’s the counterintuitive part, though: conversion rates actually went up at the same time. The average Google Ads conversion rate climbed to 8.18% in 2025. So while traffic is getting more expensive, plenty of advertisers are squeezing more value out of every click they pay for.
What that tells us is that paid search is changing in a pretty fundamental way. Buying volume and hoping enough of it converts just doesn’t work anymore. CPCs rose across 87% of industries in 2025, which means cheap paid search traffic is largely behind us. The advertisers winning right now are the ones who’ve adapted to smarter automation, better targeting, and stronger fundamentals across their accounts.
So what’s actually driving these cost increases? Which industries are getting hit hardest? And what should you realistically be doing differently in 2026? Let’s get into it.
Why Google Ads costs keep climbing year over year
There’s no single explanation for why Google Ads keeps getting more expensive. It’s a mix of more advertisers competing for the same attention, Google’s auction dynamics becoming more sophisticated, and certain industries facing cost pressures that have been building for years. Understanding what’s actually driving the increases helps you respond intelligently instead of just absorbing the hits.
Breaking down the 2025 CPC benchmarks by industry
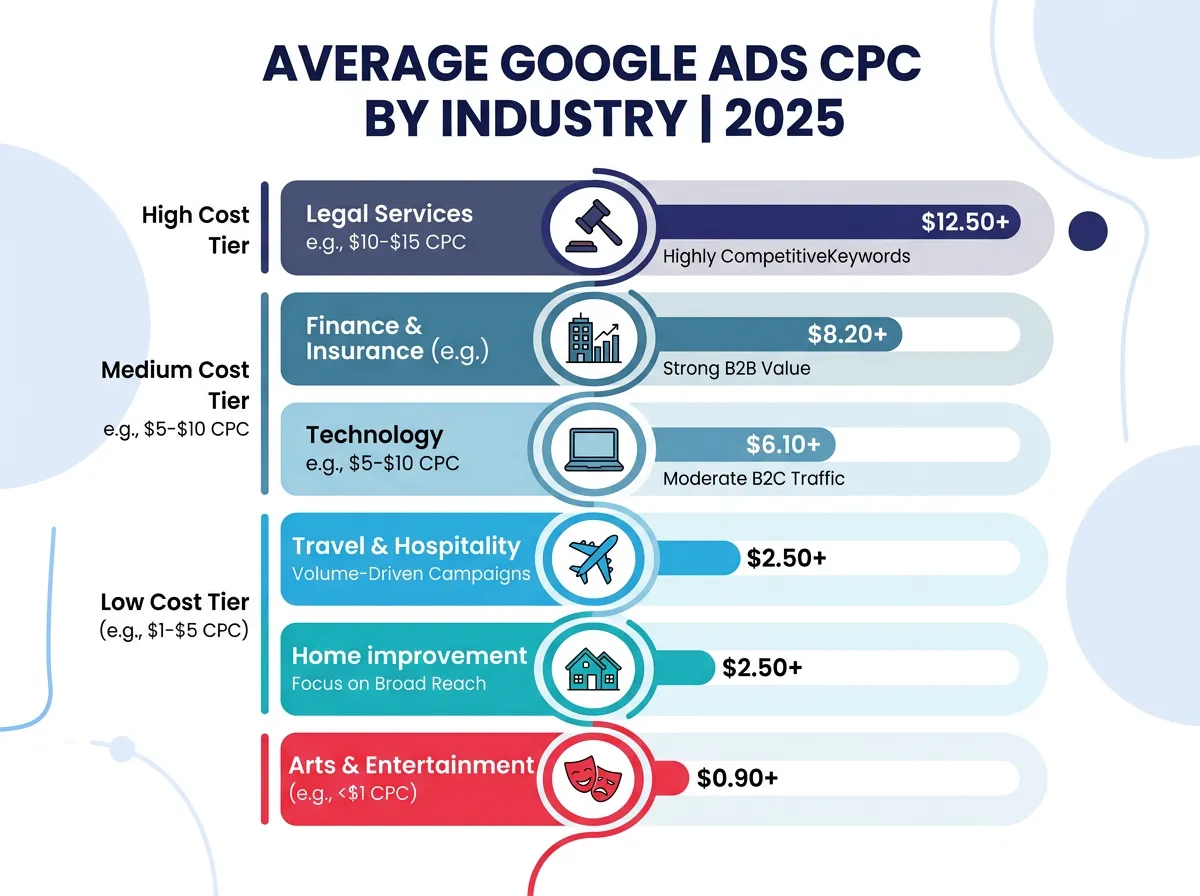
The headline number is $5.26 across all industries for average Google Ads cost-per-click in 2025, up from $4.66 in 2024. But averages hide a lot. When you look at the Google Ads benchmarks 2025 data by vertical, the spread is pretty dramatic.
Legal services sits at the top with an average CPC of $8.58. Finance and insurance and home improvement are both in the $7 and above range consistently. On the other end, arts and entertainment and travel and hospitality hover in the $2 to $3 range, with some local service industries coming in under $3 due to lower competition.
That spread matters enormously depending on where you operate. A law firm managing a tight local ad budget is working in a completely different cost environment than a boutique travel company. Both need to be strategic, but the levers they should pull are different.
| Industry | Avg. CPC Range | Notes |
|---|---|---|
| Attorneys & Legal Services | $8.58 | Highest CPC industry |
| Finance & Insurance | $7+ | Consistently expensive vertical |
| Home Improvement | $7+ | High competition, high ticket |
| Arts & Entertainment | $2-$3 | Among the lowest CPCs |
| Travel & Hospitality | $2-$3 | Lower competition, lower intent |
For most advertisers, the real takeaway isn’t to panic about CPC increases but to get sharper about whether those clicks are actually worth what you’re paying. Cost-per-click is just one part of the equation. What actually matters is what happens after someone clicks your ad.
 ### Cost-per-lead trends: is the inflation finally slowing down?
The cost per lead Google Ads data tells a slightly more hopeful story. Average CPL rose to $70.11 in 2025, up from $66.69 in 2024. That’s a 5.13% increase, which sounds steep until you compare it to the sharper jumps from prior years.
That slower rate of increase might mean we’re approaching some stabilization in paid media costs after a long stretch of steep inflation. It’s too early to call it a plateau, but the deceleration is worth paying attention to. Legal services still sees some of the highest CPLs, while automotive repair remains comparatively efficient for lead generation.
The broader point here is that cost-per-lead is a more useful number for most advertisers than CPC alone. If you can push your CPL down even as CPCs rise, by improving landing pages, tightening targeting, or using smarter bidding, you’re still growing your efficiency. That’s what the data suggests the better-performing accounts are doing right now.
Conversion rates are improving: how automation is reshaping Google Ads performance
One of the more counterintuitive findings in this year’s benchmark data is that conversion rates are going up even as costs rise. If traffic were just getting more expensive without any improvement in quality, you’d expect conversion rates to stay flat or even drop. The fact that they’re climbing suggests something else is happening under the hood.
Which industries are converting best (and why it matters)
The Google Ads conversion rate 2025 data shows a clear pattern: industries with strong local intent and lower-complexity decisions convert at much higher rates than high-consideration or B2B categories.
Automotive repair leads all industries with a 14.67% conversion rate. That makes sense when you think about it. Someone searching for a brake repair shop nearby is already pretty much ready to call. The decision cycle is short, the intent is high, and geography narrows the options down fast. Finance and insurance, by contrast, sits at just 2.55%. People shopping for financial products are doing a lot of research, comparing multiple options, and often waiting a while before committing.
This spread illustrates something worth taking seriously: your industry shapes your performance ceiling in ways that budget alone can’t change. If you’re in a high-consideration category, chasing a 10% conversion rate is probably not realistic. What matters more is understanding what a good rate actually looks like for your vertical and optimizing toward that number.
| Industry | Avg. Conversion Rate | Why |
|---|---|---|
| Automotive Repair | 14.67% | High intent, short decision cycle |
| Home Services (local) | 12-14% | Local, need-driven searches |
| Finance & Insurance | 2.55% | Complex, high-consideration purchase |
| B2B / Legal / High-Ticket | 3-5% | Long sales cycle, multiple stakeholders |
Knowing where your industry benchmarks actually land helps you set realistic targets, have more honest conversations about budget, and allocate spend toward the campaigns and keywords that are actually moving things.
Smart Bidding and Performance Max: what the data actually shows
The improvement in overall conversion rates lines up with how widely Google’s automation tools have been adopted over the past few years. Smart Bidding performance has become a major factor shaping outcomes across verticals. Performance Max campaigns, which run across all of Google’s inventory with AI-driven optimization, have also become a bigger part of many advertisers’ strategies.
The data suggests these tools work when they’re set up well. Advertisers who feed their campaigns strong signals, whether that’s conversion data, audience lists, asset quality, or first-party data, are seeing automation improve efficiency in ways manual bidding often couldn’t match.
That said, automation isn’t a magic fix. Accounts with weak signals, messy tracking setups, or not enough conversion data for the algorithm to learn from often see the opposite effect. The tool is only as good as what you put into it.
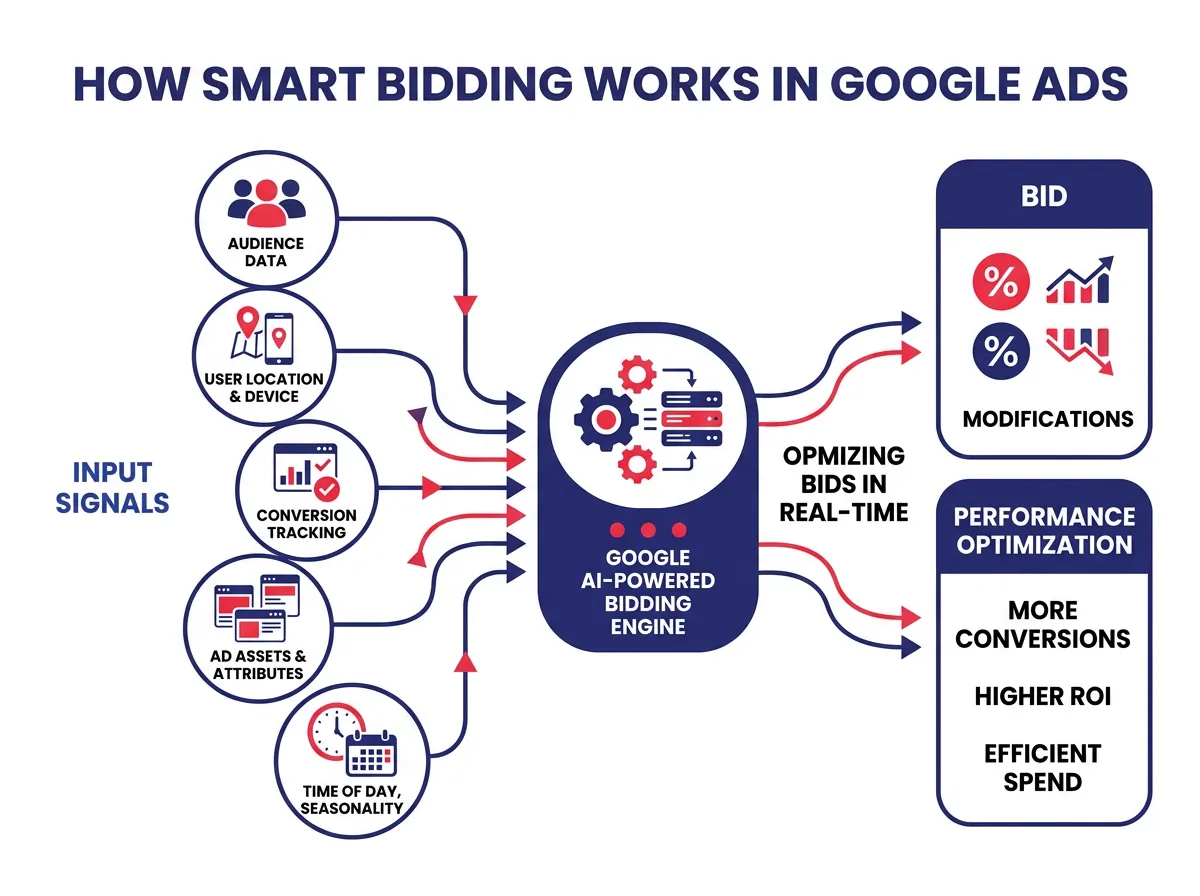 The practical implication is that setting up your campaigns for automation to succeed has become just as important as campaign structure itself. Conversion tracking needs to be airtight. Audience signals should be added intentionally. And Performance Max campaigns need strong creative assets and clear business goals to perform anywhere near their potential.
What advertisers should prioritize in Google Ads going into 2026
The benchmark data is useful context, but what do you actually do with it? There are some clear themes in this year’s numbers that translate directly into strategy.
Account hygiene still wins: the case for negative keywords and proper tracking
Here’s a number worth sitting with: nearly 29% of Google Ads accounts recorded zero conversions over a 90-day period, according to WordStream’s analysis of more than 15,000 accounts. That’s a lot of money spent with nothing to show for it.
A lot of that wasted spend comes down to basic Google Ads account performance issues that are entirely fixable. Weak or missing conversion tracking means you don’t actually know what’s working. Without that data, your bidding strategies are flying blind. And without negative keywords, you’re paying for clicks from searches that have nothing to do with your actual offer.
The negative keywords finding is especially striking. Accounts using them saw conversion rates up to three times higher than those without them. That’s not a marginal difference. That’s the kind of improvement that can make or break campaign profitability. Yet a significant portion of accounts still aren’t using them properly.
The negative keywords conversation isn’t new, but it often gets pushed aside in favor of chasing new features and campaign types. In a world where every click costs more, letting irrelevant traffic drain your budget is a much more expensive mistake than it used to be.
The same logic applies to tracking. If your conversion actions aren’t set up correctly, Google’s Smart Bidding algorithms are optimizing toward the wrong outcomes. You might be running a campaign that looks healthy in the dashboard but is actually generating low-quality leads or tracking page views as conversions. Auditing your tracking setup at least quarterly should be non-negotiable.
How to compete when clicks are expensive: a practical playbook
When traffic is expensive, competitive advantage shifts away from who can spend the most and toward who can do the most with what they spend. That means the post-click experience matters more than it ever has.
Here’s what the data consistently points toward for Google Ads optimization heading into 2026:
- Tighten your landing pages. Your landing page should match your ad’s message closely, load fast on mobile, and have one clear call to action. The difference between a 3% and a 6% conversion rate often comes down to landing page quality, not the ad itself.
- Use audience segmentation intentionally. Layering audience lists onto search campaigns lets you adjust bids or tailor messaging based on whether someone is a new visitor, a past customer, or someone who abandoned a form. These signals help you spend more efficiently.
- Feed automation better inputs. If you’re running Smart Bidding or Performance Max, the quality of your campaign inputs directly affects performance. Upload customer match lists, add strong creative assets, and make sure your conversion tracking reflects real business outcomes.
- Prioritize high-intent keywords. When CPCs are high across the board, you can’t afford to chase broad, low-intent traffic. Tighter keyword targeting, especially with exact and phrase match, keeps your budget focused on searches that are actually likely to convert.
- Review your search term reports regularly. This is where you find both the negative keyword opportunities you’re missing and the high-performing queries you might want to target more deliberately.
The accounts growing profitably right now aren’t just spending more. They’re doing the fundamentals better than their competitors. Clean tracking, strong landing pages, smart use of automation signals, and consistent negative keyword hygiene are the unglamorous things that separate accounts that scale from ones that stall.
Rising costs are a reality every advertiser is dealing with in 2025. The ones navigating it best aren’t fighting the trend. They’re building more efficient, better-optimized accounts that get more out of every dollar spent. That’s what the data shows, and it’s where your energy should go heading into 2026.