TL;DR
- Instagram is reported to have over 2 billion monthly active users, and businesses that use its built-in analytics are said to grow followers three times faster than those that do not.
- Adam Mosseri, Instagram's head, is quoted confirming that watch time, likes-per-reach and direct-message shares are the three most important Reels ranking factors.
- The benchmarks given are an average Reels reach rate of 30.81%, engagement rates of 0.52% for carousels, 0.50% for Reels and 0.35% for single images, and a healthy business-account engagement rate of 1.5% to 3%.
- Reels are called the strongest discovery format because 55% of their views come from non-followers; 15 to 30 second Reels perform best for engagement while 60 to 90 second Reels drive more saves and shares.
- Native Instagram Insights retains only 90 days of history and shows no competitor data; on Stories a completion rate above 70% is excellent and below 50% signals Stories that are too long, too slow or not relevant.
Instagram now has over 2 billion monthly active users — and businesses that use its built-in analytics are growing followers 3× faster than those flying blind. Yet most brands barely scratch the surface of what Instagram Insights reveals. They check likes, glance at follower counts, and move on. That is exactly the gap this guide closes. Whether you are a Bangkok startup posting twice a week or a regional brand running paid campaigns, understanding how to read and act on Instagram analytics is the highest-leverage habit you can build for sustainable social growth in 2026.
What Is Instagram Analytics and Why It Matters for Business
Instagram analytics is the collection of performance data Instagram records every time someone views, interacts with, or shares your content. The platform's native tool — Instagram Insights — is available free to every Business and Creator account. It tracks everything from how many unique accounts saw your latest Reel to which hour of the day your followers are most likely to be scrolling.
Why does this matter? Because the Instagram algorithm no longer rewards posting volume or raw follower count. In 2026, Instagram's ranking signals have shifted decisively toward watch time, shares, and saves. Adam Mosseri, Instagram's head, confirmed that watch time, likes-per-reach, and direct-message shares are now the three most important Reels ranking factors. If you do not measure these metrics, you cannot improve them — and you will keep producing content that looks good but goes nowhere.
The other reason analytics matter is efficiency. Instagram advertising costs have risen steadily. Brands that use data to inform both organic and paid decisions get more from every baht or dollar they spend, reaching the right audiences rather than casting a wide, expensive net.
Setting Up Instagram Analytics: The Quick-Start Checklist
Before you can analyse anything, your account needs to be in the right mode. Run through this checklist once and you will never have to revisit it.
- Switch to a Business or Creator account. Go to Settings → Account → Switch to Professional Account. Personal accounts do not have access to Insights. Choose "Business" if you are a brand or agency; choose "Creator" if you are an individual content producer.
- Connect to a Facebook Page. This unlocks the full Insights dashboard and enables cross-posting analytics inside Meta Business Suite. In Settings → Linked Accounts, connect your Facebook Page. If you do not have a Page yet, create a basic one — it takes two minutes.
- Enable Meta Business Suite access. Visit business.facebook.com and add your Instagram account. This gives you a second analytics interface with a longer 90-day data window and the ability to schedule posts in advance.
- (Optional) Connect a third-party tool. Native Insights only retains 90 days of history and shows no competitor data. If you manage multiple accounts or need year-over-year comparisons, tools like Iconosquare, Sprout Social, or Later are worth the investment.
Once those steps are done, tap the Professional Dashboard button on your profile page — you will land directly in your analytics overview.
Navigating the Instagram Insights Dashboard
Instagram Insights is organised into three main areas: Overview, Audience, and Content. Understanding the layout saves time and prevents you from missing key data points.
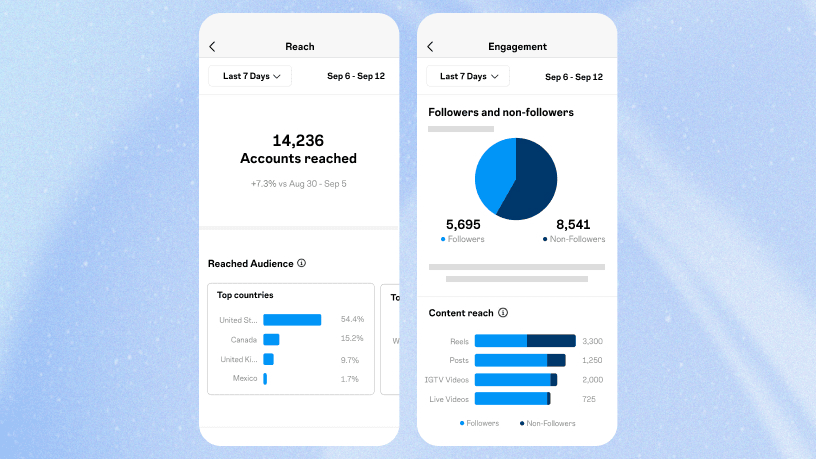
Overview shows top-level account metrics: accounts reached, accounts engaged, total followers, and content interactions over a chosen date range (7, 14, or 30 days). This is your "at a glance" health check.
Audience breaks down who follows you — their age ranges, gender split, top cities and countries, and most active times by day and hour. This section is where you build your posting schedule and audience persona.
Content lists performance data for every post, Story, Reel, and Live video you have published. You can sort by any metric — reach, impressions, engagement, saves — to immediately identify your best and worst performers.
One often-overlooked feature: tap any individual post inside the Content tab and scroll to the "Accounts Reached" breakdown. It tells you what percentage of your reach came from followers versus non-followers (i.e., discovery). A high non-follower reach percentage signals that the algorithm pushed your content beyond your existing audience — a strong growth signal worth replicating.
The 8 Instagram Metrics That Actually Drive Business Growth
Not all metrics are equal. Here are the eight that professional social media managers and agencies watch most closely in 2026, and what each one tells you about your strategy.
| Metric | What It Measures | Why It Matters in 2026 | Benchmark (Business Accounts) |
|---|---|---|---|
| Reach | Unique accounts that saw your content | Core distribution signal; rising reach = algorithm is promoting you | Reels avg. reach rate: 30.81% |
| Impressions | Total times your content was displayed | High impressions with low reach = same users seeing content repeatedly | Varies by format and audience size |
| Engagement Rate | Interactions ÷ Reach × 100 | Quality of connection; 1.5–3% is healthy for brands in 2026 | Carousels: 0.52% | Reels: 0.50% | Single image: 0.35% |
| Saves | How many users bookmarked the post | High-intent signal; saved content gets redistributed by the algorithm | Avg. Reel: 28 saves |
| Shares | How many times content was sent via DM or shared to Stories | Strongest growth metric in 2026; shares = organic amplification | Growing YoY as algorithm weights DM shares heavily |
| Watch Time / Completion Rate | % of Reel or video watched end-to-end | #1 Reels ranking factor; aim for 60%+ 3-second hold rate | Strong: 60%+ hold rate; weak: below 40% |
| Follower Growth Rate | Net new followers over a period | Lags content quality by 2–4 weeks; a lagging indicator of strategy success | Healthy: 1–3% monthly growth |
| Profile Visits | Users who tapped through to your profile | Measures curiosity generated by your content; precedes follows and link clicks | Benchmark against your own historical average |
Key insight: In 2026, Instagram's algorithm weights shares, saves, and watch time far more heavily than likes or follower count. Brands still optimising for likes are playing by 2020 rules. Shift your primary KPIs to shares-to-reach ratio and Reel completion rate for the fastest growth.
Understanding Your Audience: Demographics, Behaviour, and Timing

The Audience section of Instagram Insights is arguably the most powerful — and most underused — part of the dashboard. Understanding your audience is key for any effective marketing strategy, and Instagram analytics lets you dive deep into the demographics, locations, and online behaviours of your current followers.
Age and gender breakdown. You can see the age range and gender split of your followers in clear bar charts. If your product targets 25–34-year-old women but your followers skew 18–24 male, that is a strategic misalignment your content is causing — and analytics is how you catch it.
Geographic data. The top cities and countries your followers are based in matter enormously for timing, language, and cultural relevance. A Bangkok-based brand might discover that a substantial portion of their audience is actually in Jakarta or Kuala Lumpur — signalling regional expansion potential worth exploring.
Most active times. Instagram shows you, by day of week and hour of day, when your followers are actually on the app. This is your posting schedule. There is no universal "best time to post" — it depends entirely on your specific audience. Check this section monthly, because audience behaviour shifts with seasons, campaigns, and algorithm changes.
Follower growth timeline. Spikes in your follower count that align with specific posts, collaborations, or campaigns tell you exactly what acquisition strategies are working. Dips often align with posting gaps or content that missed the mark. Track this as a trend line, not a daily number.
One advanced move: monitor demographic shifts over time. If you are running a campaign targeting a new segment and you see that segment growing in your Audience insights, the campaign is working. If the numbers stay flat, you need to revisit the targeting or creative.
Analysing Your Content Performance: Posts, Carousels, and Reels

Different content formats behave very differently on Instagram, and your analytics will reflect this clearly.
Single-image posts have the lowest average engagement rate (0.35% per recent benchmarks) but are still valuable for brand-building and product announcements. They are quick to produce and easy to test. Use image posts for polished, high-quality visuals where the message is self-contained.
Carousel posts consistently show the highest engagement rate among all Instagram formats (0.52% in Q1 2026). The "swipe to see more" mechanic keeps users engaged longer, which the algorithm interprets as a positive signal. Carousels work best for educational content, before-and-after stories, and step-by-step guides.
Reels deliver the broadest reach of any format. With an average Reels reach rate of 30.81% — more than twice the reach rate of carousels and image posts — Reels are your primary tool for reaching new audiences. Critically, 55% of Reels views come from non-followers, making them Instagram's strongest discovery format. Reels between 15–30 seconds perform best for engagement; 60–90 second Reels drive higher saves and shares.
When analysing content performance, sort your posts by different metrics depending on your current goal:
- Goal: Grow reach → Sort by Impressions and Accounts Reached. Look for common themes in your top performers.
- Goal: Build engagement → Sort by Engagement Rate. Look for content types, caption styles, and calls to action that sparked the most interaction.
- Goal: Drive saves → Sort by Saves. Educational carousels and "save this for later" posts typically dominate here.
- Goal: Generate traffic → Sort by Profile Visits and Link Clicks (for Stories with link stickers or bio link taps).
Look for patterns across your top 10 performers every month. Was it a specific caption length? A particular visual style? A hashtag strategy? The data will tell you what to replicate — and what to stop producing.
Instagram Stories Analytics: The Engagement Layer Most Brands Miss

Instagram Stories have become a primary channel for businesses to share time-sensitive, behind-the-scenes, and interactive content. The analytics available for Stories are distinct from feed posts, and many brands fail to interpret them correctly.
Key Stories metrics:
- Reach and Impressions — how many accounts saw at least one frame of your Story sequence
- Completion Rate — percentage of viewers who watched through to the last frame without tapping away
- Exits — the exact frame where viewers tapped out of your Story. High exits at a specific slide reveal what is boring or irrelevant to your audience.
- Replies — direct messages sent in response to a Story, a strong intimacy signal
- Link Clicks — taps on your link sticker, the most direct conversion-driving action in Stories
- Sticker Interactions — poll responses, quiz answers, question replies — all indicate active engagement with your brand

The completion rate metric is your primary Stories health indicator. A completion rate above 70% is excellent. Anything below 50% suggests your Stories are either too long, too slow-paced, or not relevant enough to your audience.
Watch the Exit points carefully. If you post a 10-frame Story and most viewers exit at frame three, every frame after that is wasted creative effort. Restructure your Story so the most valuable content appears in frames 1–4, and use curiosity hooks to pull viewers forward.
Stories analytics also complement your overall content strategy. Use Stories to test messaging, offers, and formats that you can later scale to feed posts and Reels once the data confirms they resonate.
Reels Analytics: The Growth Engine You Cannot Afford to Ignore
Reels are now Instagram's dominant growth format, and their analytics are more detailed than any other content type. If you are not already treating Reels analytics as a separate discipline, 2026 is the year to start.
When you tap on any Reel inside your Content analytics, you will see:
- Plays — total number of times the Reel started playing (including replays)
- Accounts Reached — unique accounts exposed to the Reel
- Likes, Comments, Saves, Shares — the four core engagement pillars
- Average Watch Time — how many seconds, on average, viewers watched
- Retention Curve — a graph showing at which second viewers drop off
The retention curve is the most actionable piece of Reels data. It shows you, second by second, where you are losing viewers. A steep drop in the first 3 seconds means your hook is weak. A cliff at 10 seconds means your pacing lost momentum. Use this curve to edit your next Reel before you post it — if you can push the 3-second retention above 60%, your Reel will be distributed far more aggressively by the algorithm.
Reels between 15–30 seconds consistently outperform longer formats for engagement rate, while 60–90 second Reels tend to generate more saves and shares. Both are valuable — choose the length based on your goal for that specific video.
One practical tip: when a Reel significantly outperforms your average (say, 3× your usual reach), immediately look at what made it different. Was it the opening hook? The audio choice? The caption structure? The hashtags? Document those variables and test them in the next three Reels. Over time, you will build a clear model of what makes your specific audience respond.
Paid Instagram Analytics: Connecting Ads Data to Organic Insights
Up until now, we have focused on organic analytics around your own Instagram account, content, and audience behaviour. But many businesses are also investing in paid promotion through Instagram advertising.
If you are running paid Instagram campaigns, the analytics metrics available through Meta Ads Manager open an entirely new realm of audience targeting intelligence.
Key paid metrics to monitor include:
- Cost Per Result (CPR) — whether your result is a click, lead, purchase, or view, this tells you efficiency of spend
- Click-Through Rate (CTR) — percentage of people who saw the ad and clicked it; average Instagram CTR sits around 0.5–1.5%
- Frequency — average number of times the same person has seen your ad; above 3–4, fatigue sets in and performance drops
- Audience Overlap — what percentage of your custom audiences overlap with each other
- Demographic Breakdowns — age, gender, placement, and device data for who actually converts
These paid analytics give you powerful insight into which audience segments are most interested in your offerings. You can then use those learnings to laser-focus your targeting for maximum ROI from your paid spend. Perhaps your ads resonated best with males in a certain age range, or you noticed surprisingly high engagement rates from an unexpected geographic region. Analytics allows you to identify these nuanced patterns that can completely shift your paid strategy.
Viewing Organic Alongside Paid Analytics: Closing the Loop
For many brands, the real analytical insight comes from viewing paid and organic metrics in tandem. This combined picture reveals opportunities for synergy between channels.
You may notice certain themes or visual styles that reliably drive high engagement organically also tend to perform strongly in your paid ads. Those are clear signals to double down on — both in your creative budget and your organic calendar.
Or you may spot gaps between the two channels — demographics you reach well organically but struggle with via paid promotion. This gap could inspire new messaging approaches, retargeting campaigns, or influencer collaborations to bridge the divide.
A useful practice: every month, export your top five organic posts and your top five paid creatives. Compare them side by side. Do they share a visual language? A tone of voice? A content format? If your best organic content and your best paid content look nothing alike, you are running two disconnected brand identities — a common problem that analytics quickly exposes.
Instagram Analytics vs. Third-Party Tools: When to Upgrade
Instagram Insights is an excellent starting point, but it has real limitations that growing businesses will hit quickly.
| Feature | Instagram Insights (Native) | Third-Party Tools (e.g., Iconosquare, Sprout Social, Later) |
|---|---|---|
| Cost | Free | $19–$299/month depending on tier |
| Data history | 90 days maximum | Unlimited (stores from day of connection) |
| Competitor analysis | None | Yes — track competitor posting frequency, engagement, and top content |
| Multi-account management | Limited (one account at a time) | Yes — manage and compare multiple accounts |
| Automated reporting | Manual export only | Scheduled PDF/email reports |
| Cross-platform analytics | Instagram only | Often includes Facebook, TikTok, LinkedIn, Twitter/X |
| Best for | Solo creators, small businesses | Agencies, growing brands, multi-platform teams |
The decision point: if you need competitor benchmarking, multi-account dashboards, or data older than 90 days, invest in a third-party tool. If you are a solo operator or early-stage business, native Insights plus Meta Business Suite will serve you well for the first 12–18 months.
Building an Analytics Review Routine That Actually Works
Checking analytics is not the same as using analytics. The most data-literate social teams in the world are not the ones who log in every day — they are the ones who have a structured review cadence that turns numbers into decisions.
Here is a framework that works for businesses of any size:
Weekly check (15 minutes): Look at the past 7 days. Which posts performed above or below your average reach and engagement? Note any outliers. Adjust your upcoming posting plan based on what the data suggests.
Monthly review (60 minutes): Analyse the full month's content performance. Calculate your average engagement rate, reach rate, and follower growth rate. Compare to the previous month. Identify your top three content themes by engagement. Update your content calendar for the next month accordingly.
Quarterly strategy session (2–3 hours): Pull 90 days of data. Assess whether your Instagram goals (reach, engagement, traffic, leads) are trending in the right direction. Benchmark your engagement rate against industry averages. Adjust your format mix — for example, if you have been posting mostly single images but Reels are consistently outperforming, reallocate production resources.
The key principle: track trends, not moments. A single post getting 1,000 likes is a moment. A 20% increase in average engagement over three months is a trend. Trends are what tell you whether your strategy is working — and they only become visible when you review data consistently over time.
Embracing an Analytics-First Instagram Strategy
Hopefully this gives you a comprehensive overview of how Instagram analytics can be powerfully transformative for your brand's presence on the platform. The brands winning on Instagram in 2026 are not the ones with the biggest budgets or the most followers — they are the ones making the smartest decisions with the data they already have access to for free.
To make analytics a sustainable habit rather than an occasional task, adopt this four-step cycle:
- Collect: Use Instagram Insights and, if relevant, a third-party tool to gather all available data from your account, audience, and content performance.
- Analyse: Look for patterns, anomalies, and correlations. Ask "why" when a post significantly over- or under-performs.
- Adapt: Pivot your content strategy and experiment with adjustments based on analytics-driven insights. Test one variable at a time to isolate what is causing performance changes.
- Assess: Monitor the impact of your changes over the following 2–4 weeks. Then repeat the cycle.
Keep three principles at the front of your mind: start simple by focusing on the two or three metrics most relevant to your current business goal; always interpret data from the audience's perspective; and treat every insight not as a conclusion but as a hypothesis to test next.
With that approach — patient, audience-first, and relentlessly iterative — you will be leveraging Instagram's powerful analytics to drive serious growth for your business in 2026 and beyond. Contact our social media team at Relevant Audience if you would like any help building or refining your Instagram analytics strategy.
Frequently Asked Questions About Instagram Analytics
How do I access Instagram analytics on my phone?
Tap your profile picture to go to your profile, then tap the Professional Dashboard button just below your bio and follower count. This opens Instagram Insights directly. You must have a Business or Creator account to see this button — personal accounts do not have access to Insights.
What is a good engagement rate on Instagram in 2026?
For business accounts in 2026, a healthy engagement rate sits between 1.5% and 3%. However, this varies significantly by account size and niche. Nano-influencers (under 10,000 followers) often see rates of 4–6%, while large brand accounts with millions of followers may see 0.3–0.8%. Compare your rate to your own historical average first, then to competitors in your specific industry.
How often should I check Instagram analytics?
A brief weekly check (10–15 minutes) is enough to catch outliers and inform your next week's content. A deeper monthly review (about an hour) lets you identify trends and adjust your strategy. Checking daily is counterproductive — individual days are too noisy to draw meaningful conclusions from.
Can I see competitor analytics on Instagram?
Instagram Insights only shows data for your own account. To analyse competitors, you need a third-party tool such as Iconosquare, Sprout Social, or Socialinsider. These tools can show competitor posting frequency, estimated engagement rates, top-performing content formats, and audience growth trends.
What is the difference between reach and impressions on Instagram?
Reach is the number of unique accounts that saw your content. Impressions is the total number of times your content was displayed — including multiple views by the same person. If your impressions are much higher than your reach, it means the same users are seeing your content repeatedly. For growth, prioritise increasing reach (new eyeballs) over impressions.
Why are my Instagram analytics not showing data?
The most common reasons are: (1) your account is set to Personal rather than Business or Creator; (2) the account is less than a week old and has not yet generated enough data; (3) you are looking at a date range with no posts published; or (4) there is a temporary glitch in the app — try logging out and back in, or check via Meta Business Suite on desktop.
Do Instagram Reels have their own analytics?
Yes. Each Reel has its own detailed analytics page showing plays, accounts reached, likes, comments, saves, shares, average watch time, and a second-by-second retention curve. Access it by tapping any Reel on your profile and selecting "View Insights." The retention curve is particularly valuable — it shows exactly where viewers stop watching, allowing you to improve your hooks and pacing.
What is the best third-party Instagram analytics tool for small businesses?
For small businesses, Later (best for scheduling + basic analytics) and Buffer (simple, affordable multi-platform reporting) are strong starting points. If you need competitor tracking and deeper reporting, Iconosquare or Sprout Social offer more power at a higher price point. All have free trials, so test two before committing to a paid plan.