TL;DR
- Meta announced the Creative breakdown on 11 July 2025; it sits under Popular breakdowns in Ads Reporting and shows per-asset performance for Flexible format ads and AI-generated images from Advantage+ Creative.
- A Flexible format ad takes up to 10 images or videos, 5 primary text options, 5 headlines, 5 descriptions and 3 creative groups, and the post cites 25-40% better performance than single-asset ads in comparable tests.
- Per-asset metrics include delivery status, reach, impressions, cost per result, amount spent, engagement rate and link CTR, but bar and trend charts are disabled, leaving table view only.
- The breakdown does not work with Dynamic Creative ads, which need the Dynamic Creative Element breakdown instead, and creative-level data only covers campaigns that ran after 1 July 2017.
- The post states Meta has required AI content disclosure on ads since March 2026, and that Related media, which recycles assets from earlier campaigns in the same ad account, was still in limited rollout as of mid-2026.
Quick Summary: Meta's Creative breakdown — launched July 2025 and widely available through 2026 — lets advertisers see exactly which individual images, videos, and AI-generated assets are driving results inside Flexible format campaigns. It's the first time this data has been visible in Ads Manager, and it fundamentally changes how you optimize creative without disrupting delivery.
Why Meta's Creative Breakdown Changes Everything
If you've ever run a Flexible format campaign on Meta and wondered which of your 10 uploaded assets was actually doing the heavy lifting — you weren't alone. Until July 2025, that question had no answer. Meta's algorithm picked and served creative automatically, and advertisers had zero visibility into individual asset performance. You could see campaign-level results, but the creative layer was a complete black box.
That changed when Meta introduced the Creative breakdown option in Ads Manager — a reporting feature that finally surfaces per-asset performance data for Flexible format campaigns and AI-generated images. For digital marketing teams who run volume creative testing on Meta, this is one of the most practically useful transparency updates the platform has released in years.
This guide covers exactly what the Creative breakdown is, how to access it, what you can measure, where its limits are, and how to use it to make smarter creative decisions in 2026 — without inadvertently destabilising your campaigns.
What Is Meta's Creative Breakdown Feature?
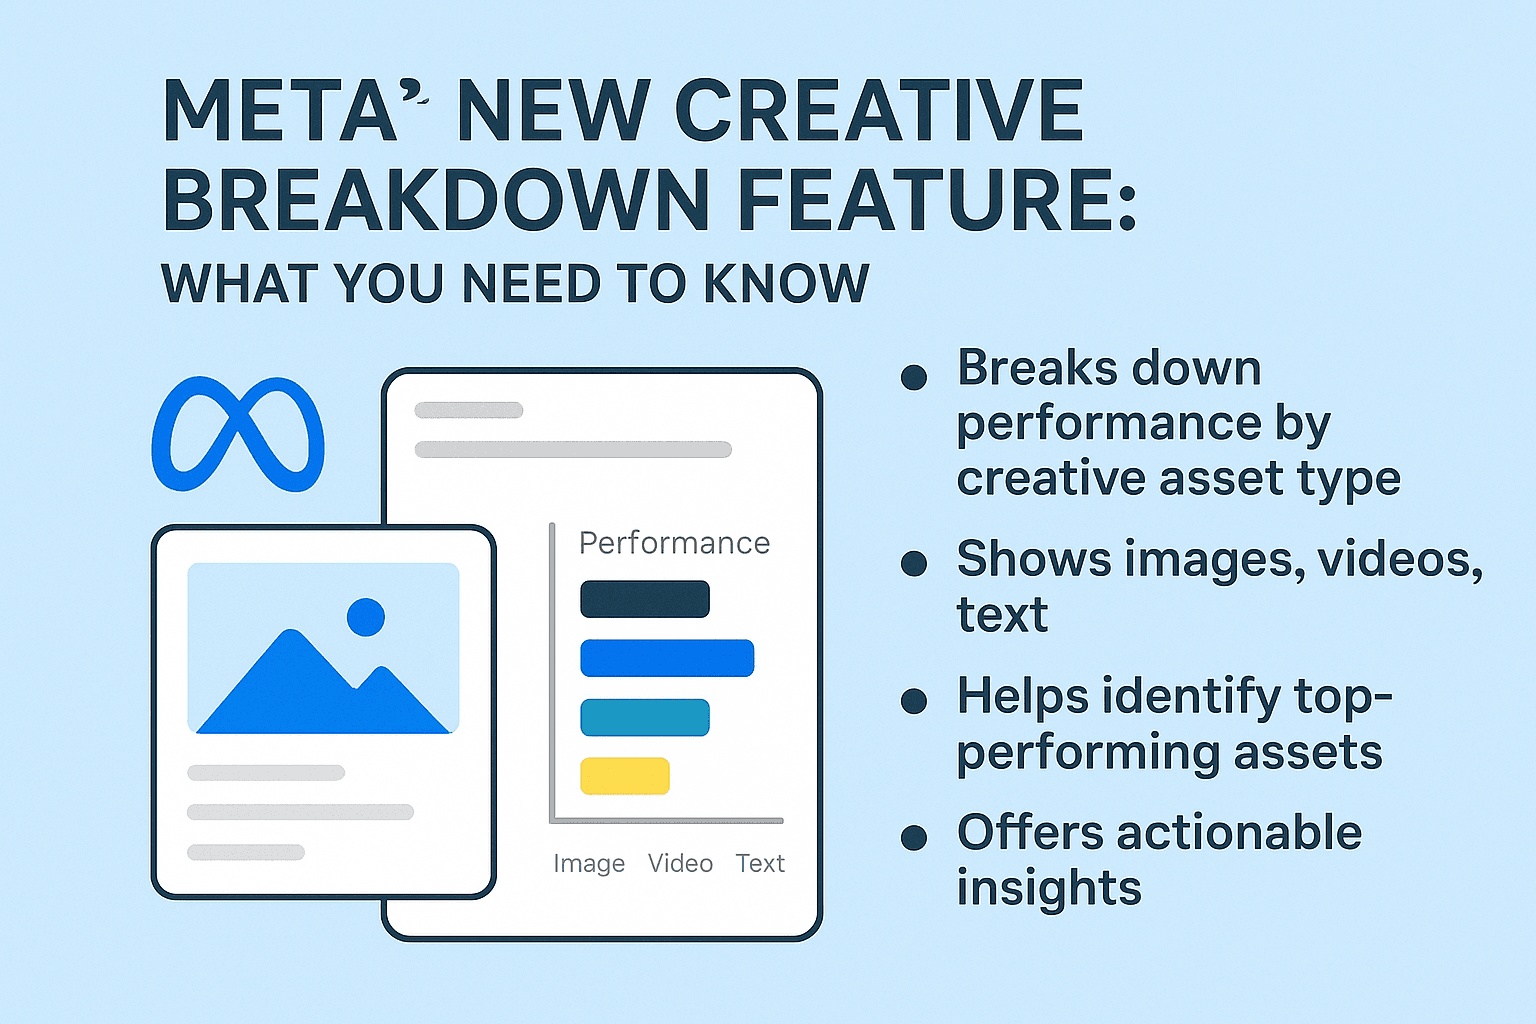
The Creative breakdown is a reporting dimension inside Meta Ads Manager that breaks campaign results down by individual creative element rather than by ad or ad set. In plain terms: instead of seeing one combined result for your entire ad, you can see how each image or video inside that ad performed on its own.
Meta announced the feature on July 11, 2025, specifically targeting two use cases:
- Flexible format ads — campaigns where you upload up to 10 images and/or videos and let Meta's algorithm choose which to show each user
- AI-generated image ads — campaigns where Meta's Advantage+ Creative has automatically generated new image variations from your original assets
Digital marketing specialist Bram Van der Hallen, who was among the first to document the feature publicly, put it directly: "Before this update, you were unable to get insights on performance data for these creative enhancements." That absence had made genuine creative optimisation inside Flexible format campaigns effectively impossible — you were guessing.
The Creative breakdown appears under the Popular breakdowns section in the right panel of Ads Reporting. It integrates with your existing Ads Manager workflow without requiring any new setup — you just apply it to a report and the data appears for eligible campaigns.
Understanding Flexible Format: The Feature the Breakdown Was Built For
To understand why Creative breakdown matters, you first need to understand what Flexible format actually does — and why it had been so difficult to measure.
Flexible format is Meta's multi-asset creative option for Sales and App Promotion campaigns. When you create a Flexible format ad, you can upload:
- Up to 10 images and/or videos per ad
- Up to 5 primary text options
- Up to 5 headlines and 5 descriptions
- Up to 3 creative groups per ad
Meta's machine learning then decides, in real time for each impression, which combination of assets to show — adapting to placement, audience behaviour, and historical performance signals. The system automatically reformats assets to fit each placement across Facebook, Instagram, Messenger, and Audience Network.
The advantage is clear: more assets mean more combinations, more combinations mean more chances to find what resonates for each specific user, and the algorithm gets smarter the more data it accumulates. Campaigns using Flexible format have reported performance improvements of 25–40% versus single-asset ads in comparable tests.
The disadvantage — until now — was equally clear: you had no idea which of your 10 assets was responsible for those gains. If your campaign was under-performing, you couldn't identify the weak assets. If it was over-performing, you couldn't confidently replicate the winners. The Creative breakdown solves this.
- Create a Sales or App Promotion campaign in Ads Manager
- For Sales: toggle off "Use a Catalog"
- Set conversion location to Website or App (not both)
- At the ad level, choose Flexible under Format selection
- Upload your assets and let Meta handle the rest
How to Access the Creative Breakdown in Ads Manager
Accessing the Creative breakdown takes about 30 seconds once you know where to look. Here's exactly how to find it:
- Open Meta Ads Manager and navigate to the Ads Reporting section
- Select the campaign, ad set, or ad you want to analyse — the breakdown works at all three levels, but is most useful at the ad level
- Look for the Breakdowns dropdown in the toolbar (between the Columns button and the Reports button)
- Click Breakdowns and scroll to the Popular breakdowns section in the right panel
- Select Creative from the available options
- Your results will now be broken out by individual creative element, with each asset shown as a separate row
When you hover over a creative thumbnail in the results, Ads Manager displays an ad placement preview so you can see exactly what the asset looks like in context — useful when you have multiple similar images and need to confirm which row corresponds to which file.
One important note: you can combine the Creative breakdown with other breakdown dimensions for more granular analysis. For example, applying both Creative and Age/Gender breakdowns simultaneously lets you see not just which asset performs best overall, but which asset performs best for each audience segment. This is where the feature becomes genuinely powerful for creative strategy.
What Metrics Does the Creative Breakdown Report?
The Creative breakdown surfaces the same core metrics available in standard Ads Manager reporting, applied at the individual asset level. Key metrics include:
| Metric | What It Tells You | Optimisation Use |
|---|---|---|
| Delivery Status | Whether Meta is actively serving this asset | Identify under-served or suppressed assets |
| Reach | Unique users who saw this specific asset | Understand which assets Meta favours for distribution |
| Impressions | Total times this asset was shown | Spot assets that dominate delivery vs. those that are rarely served |
| Cost Per Result | Efficiency of this asset in achieving your campaign objective | Direct indicator of which assets drive results most cheaply |
| Amount Spent | Budget allocated to this asset by Meta's algorithm | Correlate spend allocation with performance — Meta generally spends more on better-performing assets |
| Engagement Rate | Likes, comments, shares, and saves per impression for this asset | Identify creative that resonates emotionally even without direct conversion |
| CTR (Link) | Click-through rate to your landing page for this specific asset | Measure which creative drives curiosity and intent |
One caveat: bar and trend chart views are not supported when using the Creative breakdown. You'll be working in table view, which is fine for analysis but means you can't visualise individual asset performance over time in the same way you can for standard campaign metrics. Exporting the data to a spreadsheet and building your own charts is the practical workaround most advertisers use.
Tracking AI-Generated Image Performance
The second major use case for Creative breakdown is measuring how Meta's AI-generated images perform compared to your original uploaded assets. This matters because by 2025–2026, Meta's Advantage+ Creative suite had expanded significantly, and many advertisers were running AI-generated variations without any way to assess their actual contribution to results.
Meta's Advantage+ Creative can automatically:
- Generate entirely new background images for your product shots
- Expand images to fit different aspect ratios across placements
- Apply brightness and contrast adjustments
- Animate static images into short video clips
- Add text overlays and enhanced CTAs
- Create 3D animation effects from flat product images
With Creative breakdown enabled, each of these AI-generated variants appears as its own row in your report — distinct from your original creative. You can directly compare Cost Per Result, Impressions, and Amount Spent between your human-produced assets and Meta's AI-generated alternatives.
This data matters practically. In Q1 2025, Meta reported a 30% increase in advertisers using AI creative tools — but without performance data at the asset level, most couldn't validate whether those tools were helping or hurting. The Creative breakdown provides the evidence needed to make that call.
What early data suggests: AI-generated image variations tend to receive significant spend allocation in the early days of a campaign as Meta tests them, but performance on efficiency metrics like Cost Per Conversion varies substantially by industry and product type. For commoditised products with clear visual presentation (apparel, food, beauty), AI background variations have shown competitive performance. For high-consideration or brand-sensitive categories, original assets frequently outperform.
Since March 2026, Meta also requires disclosure on ads containing AI-generated or AI-modified content — making it even more important to know which of your active assets fall into that category. The Creative breakdown's labelling of AI-generated rows helps with compliance tracking as well as performance measurement.
The Related Media Breakdown: Meta's Automated Creative Recycling
Some advertisers are also seeing a third option alongside the standard Creative breakdown: Related media. This is worth understanding separately because it represents a different type of automation — one that pulls from your historical ad library rather than generating new content from scratch.
Related media consists of images and videos that have been previously uploaded and used in other campaigns within your ad account. Meta's system automatically identifies these assets as potentially relevant to your current campaign and may begin serving them alongside your actively uploaded creative — without you manually adding them.
The Related media breakdown lets you see:
- Which historical assets Meta has identified as relevant to your current campaign
- Whether those automatically-surfaced assets are being served, and at what scale
- How their performance compares to your intentionally uploaded creative
This feature is still in limited rollout as of mid-2026, but it represents an important direction in Meta's automation strategy: moving beyond single-campaign creative management toward account-wide creative orchestration, where strong performers from past campaigns can be automatically re-deployed in new contexts.
For advertisers with large creative libraries, this could be valuable. For those who run campaigns for multiple clients or products in the same account, it requires careful monitoring to ensure assets aren't crossing between campaigns inappropriately.
Important Limitations to Know Before You Start
The Creative breakdown is a significant improvement in Meta's reporting transparency, but it has real limitations that affect how you can use the data. Understanding these before you start optimising will prevent misinterpretation.
Dynamic Creative Ads Are Excluded
The Creative breakdown does not work with Dynamic Creative ads. If your campaign uses Dynamic Creative (a separate feature that tests combinations of creative elements), the breakdown will not surface individual element performance. For dynamic creative analysis, you need the Dynamic Creative Element breakdown — a separate option in the same Breakdowns menu.
Data Only Available From July 2017 Forward
Creative-level data is only accessible for campaigns that ran after July 1, 2017. For most active advertisers this isn't a practical constraint, but it's worth noting if you're trying to do historical analysis of older campaigns.
No Bar or Trend Chart Support
When Creative breakdown is active, bar chart and trend chart views are disabled. You can only view the data in table format within Ads Manager. If you need to visualise performance trends for individual assets over time, you'll need to export the data and build charts externally.
It's Informational, Not Prescriptive
This is the most important limitation: do not use Creative breakdown data to manually override Meta's delivery decisions. If you see one asset receiving 80% of impressions, the instinct may be to pause the other assets. Resist it. Meta's algorithm is allocating based on real-time signals across audiences, placements, device types, and times of day — signals you don't have access to. An asset that appears to "underperform" in aggregate may be the critical performer for a specific valuable audience segment. Use the data to inform future creative decisions, not to interfere with current delivery.
How to Use Creative Breakdown Data Effectively in 2026
With the caveats above in mind, here's how to extract real value from Creative breakdown without inadvertently disrupting your campaigns.
Identify Winners for Future Creative Development
The primary value of Creative breakdown is informing what you build next, not what you change today. When a campaign completes or matures past its learning phase, review the creative data and document which assets achieved the lowest Cost Per Result with meaningful spend. Build your next creative batch anchored to those winners — same format, similar visual language, similar messaging approach — while introducing controlled variations to continue learning.
Compare AI vs. Human Creative Performance
Run a deliberate comparison: launch a Flexible format campaign with 5 original assets and enable Advantage+ Creative enhancements to let Meta generate AI variants. After the campaign has exited the learning phase (typically 7 days minimum), pull the Creative breakdown and compare Cost Per Result between original and AI-generated rows. This gives you a data-backed answer to whether AI creative is working for your specific product and audience — rather than a generalised assumption.
Cross-Dimension Analysis for Placement Intelligence
Combine the Creative breakdown with the Placement breakdown to understand which assets perform best in which contexts. A vertical video may dominate on Instagram Reels but underperform in the Facebook Feed. A clean product-on-white image might excel in right-column placements. This kind of cross-dimensional analysis helps you build placement-specific creative briefs that go beyond generic "best practices."
Audience-Level Creative Intelligence
Apply Creative breakdown alongside Age and Gender breakdowns to identify which assets resonate with specific demographic groups. If a lifestyle image significantly outperforms a product-focused image among 25–34 year olds while the reverse is true for 45–54 year olds, that's actionable intelligence for both creative development and audience segmentation in future campaigns. This kind of data-driven optimisation removes guesswork from creative strategy at scale.
Creative Breakdown vs. Dynamic Creative: What's the Difference?
| Feature | Creative Breakdown (Flexible Format) | Dynamic Creative Element Breakdown |
|---|---|---|
| Works with | Flexible format ads, AI-generated image ads | Dynamic Creative ads only |
| What it breaks down | Individual images/videos within a Flexible format ad | Creative elements (image, text, headline, CTA) as separate dimensions |
| AI content tracking | Yes — AI-generated assets appear as distinct rows | No — AI modifications are not tracked separately |
| Related media visibility | Yes (where available) | No |
| Campaign objectives | Sales, App Promotion | Most objectives |
| Max assets | 10 images/videos | Up to 30 creative elements across all types |
| Chart views | Table only | Table only |
Creative Breakdown in the Context of Meta's 2026 AI Advertising Push
The Creative breakdown didn't appear in isolation. It arrived as part of a broader shift in Meta's strategy: deploying aggressive AI automation while simultaneously providing more data to justify advertiser trust in that automation.
Consider the timeline of major developments:
- January 2025: Meta removes detailed targeting exclusions, doubling down on algorithmic audience selection
- April 2025: Meta reports 16% advertising revenue growth in Q4 2024 ($46.8B) and notes 30% more advertisers using AI creative tools
- May 2025: CEO Mark Zuckerberg describes a vision where AI agents could eventually replace creative agencies for advertisers
- June 2025: Meta announces 11 new AI advertising features at Cannes Lions, including AI dubbing and persona-based image generation
- July 2025: Creative breakdown launches, giving advertisers the first data-layer visibility into how AI-generated and algorithm-selected creatives perform
- March 2026: Meta implements AI content disclosure requirements for ads containing AI-generated or AI-modified creative
The pattern is clear: Meta is automating more of the advertising process while giving advertisers better data to evaluate the results. The Creative breakdown is the accountability layer on top of Flexible format and Advantage+ Creative — it lets you verify, not just trust, that the automation is working for your specific campaigns.
For advertisers running content marketing campaigns or brand-focused ads where creative quality directly affects brand perception, this accountability layer is especially important. A 22% ROAS improvement from Advantage+ campaigns (Meta's published figure) is compelling — but it's more compelling when you can see which specific creative assets are driving it.
This also connects to digital strategy more broadly: the advertisers who will get the most from Meta's evolving AI toolkit are those who combine automated delivery with structured creative testing frameworks. Creative breakdown is the measurement infrastructure that makes that framework possible.
Key Takeaways for Meta Advertisers
- Creative breakdown is now live in Meta Ads Manager under Popular breakdowns — find it in the right panel of Ads Reporting
- It works specifically with Flexible format ads (up to 10 assets) and AI-generated image ads from Advantage+ Creative
- Metrics include delivery status, reach, impressions, cost per result, and spend — at the individual asset level
- AI-generated assets appear as distinct rows, enabling direct comparison with original human-produced creative
- Related media breakdown (in limited rollout) shows performance of historically-uploaded assets Meta is automatically recycling into your current campaigns
- Does not work with Dynamic Creative ads — use the Dynamic Creative Element breakdown for those
- Use the data to inform future creative decisions, not to manually override current delivery — the algorithm's real-time signals are more nuanced than aggregate asset-level metrics
- Since March 2026, Meta requires AI content disclosure — Creative breakdown helps you identify which active assets require disclosure labels
Frequently Asked Questions About Meta's Creative Breakdown
What is Meta's Creative breakdown feature?
Meta's Creative breakdown is a reporting option in Ads Manager that shows performance data — reach, impressions, cost per result, and spend — for each individual image or video within a Flexible format ad, as well as for AI-generated images created by Advantage+ Creative. It was launched on July 11, 2025 and marked the first time advertisers could see per-asset performance data for these campaign types.
Where do I find the Creative breakdown in Ads Manager?
Navigate to Ads Reporting in Meta Ads Manager, select your campaign or ad, then click the Breakdowns dropdown in the toolbar. Scroll to the Popular breakdowns section in the right panel and select "Creative." The data will reload with individual creative elements broken out as separate rows.
Does Creative breakdown work with all campaign types?
No. Creative breakdown is specifically designed for Flexible format ads (Sales and App Promotion campaigns where you upload multiple assets) and for campaigns using AI-generated images via Advantage+ Creative. It does not work with Dynamic Creative ads — those require the Dynamic Creative Element breakdown instead. Standard single-image or single-video ads don't benefit from the feature since there's only one asset to measure.
Can I use Creative breakdown data to pause underperforming assets?
Technically yes, but it's generally not recommended. Meta's algorithm allocates delivery based on real-time signals that are more complex than aggregate asset metrics can capture. An asset showing lower overall spend may be the top performer for a specific audience segment or placement. The best practice is to use Creative breakdown data informatively — to guide future creative development — rather than to manually intervene in current campaign delivery, which can disrupt the learning phase and reduce overall performance.
How does Creative breakdown handle AI-generated images?
AI-generated assets created by Advantage+ Creative (background generation, image expansion, 3D animation, etc.) appear as distinct, separately labelled rows in the Creative breakdown report. You can compare their Cost Per Result, Impressions, and Spend directly against your original uploaded assets. This is the first time Meta has made this comparison possible, and it lets advertisers validate whether AI creative enhancements are genuinely improving performance for their specific campaigns. Note that since March 2026, ads containing AI-generated content require disclosure per Meta's updated policies.
What is Related media in Meta Ads Manager?
Related media is an automated feature (in limited rollout as of mid-2026) where Meta identifies images or videos from your previous campaigns that it considers relevant to your current campaign, and may begin serving them alongside your current ad assets. The Related media breakdown option lets you see which historical assets are being surfaced and how they perform. This is different from Flexible format (where you deliberately upload multiple assets) — Related media pulls from your entire historical ad account library automatically.
Why can't I see bar or trend charts with Creative breakdown?
Bar chart and trend chart views are not supported when the Creative breakdown is active — this is a current platform limitation. You can only view asset-level data in table format within Ads Manager. To analyse performance trends over time for individual creative assets, export the table data and build charts in a spreadsheet tool like Google Sheets or Excel.
How many images can I include in a Flexible format ad?
You can upload up to 10 images and/or videos per Flexible format ad, along with up to 5 primary text options, 5 headlines, and 5 descriptions. You can also create up to 3 creative groups per ad. Meta's algorithm then selects the best combination for each individual impression across all placements. Creative breakdown lets you see performance data for each of those 10 assets individually, which is why the two features work together so well.


![[How to] Build a Facebook Ads Dashboard on Google Data Studio](/_next/image/?url=%2F_next%2Fstatic%2Fmedia%2FCustomer%20Service%20Process%20Automation.2gl0u7hkkquuc.webp&w=3840&q=75)