
TL;DR
- When spend is flat but reach falls and CPM climbs, the change is in Meta's delivery system, not in your offer. Delivery ranks each ad by your bid, the estimated action rate and quality signals.
- Five parts of delivery decide who sees the ad: Advantage+ structures on by default, vertical video eligibility, weight on meaningful interaction, one dataset shared across platforms, and a preference for many creative variants.
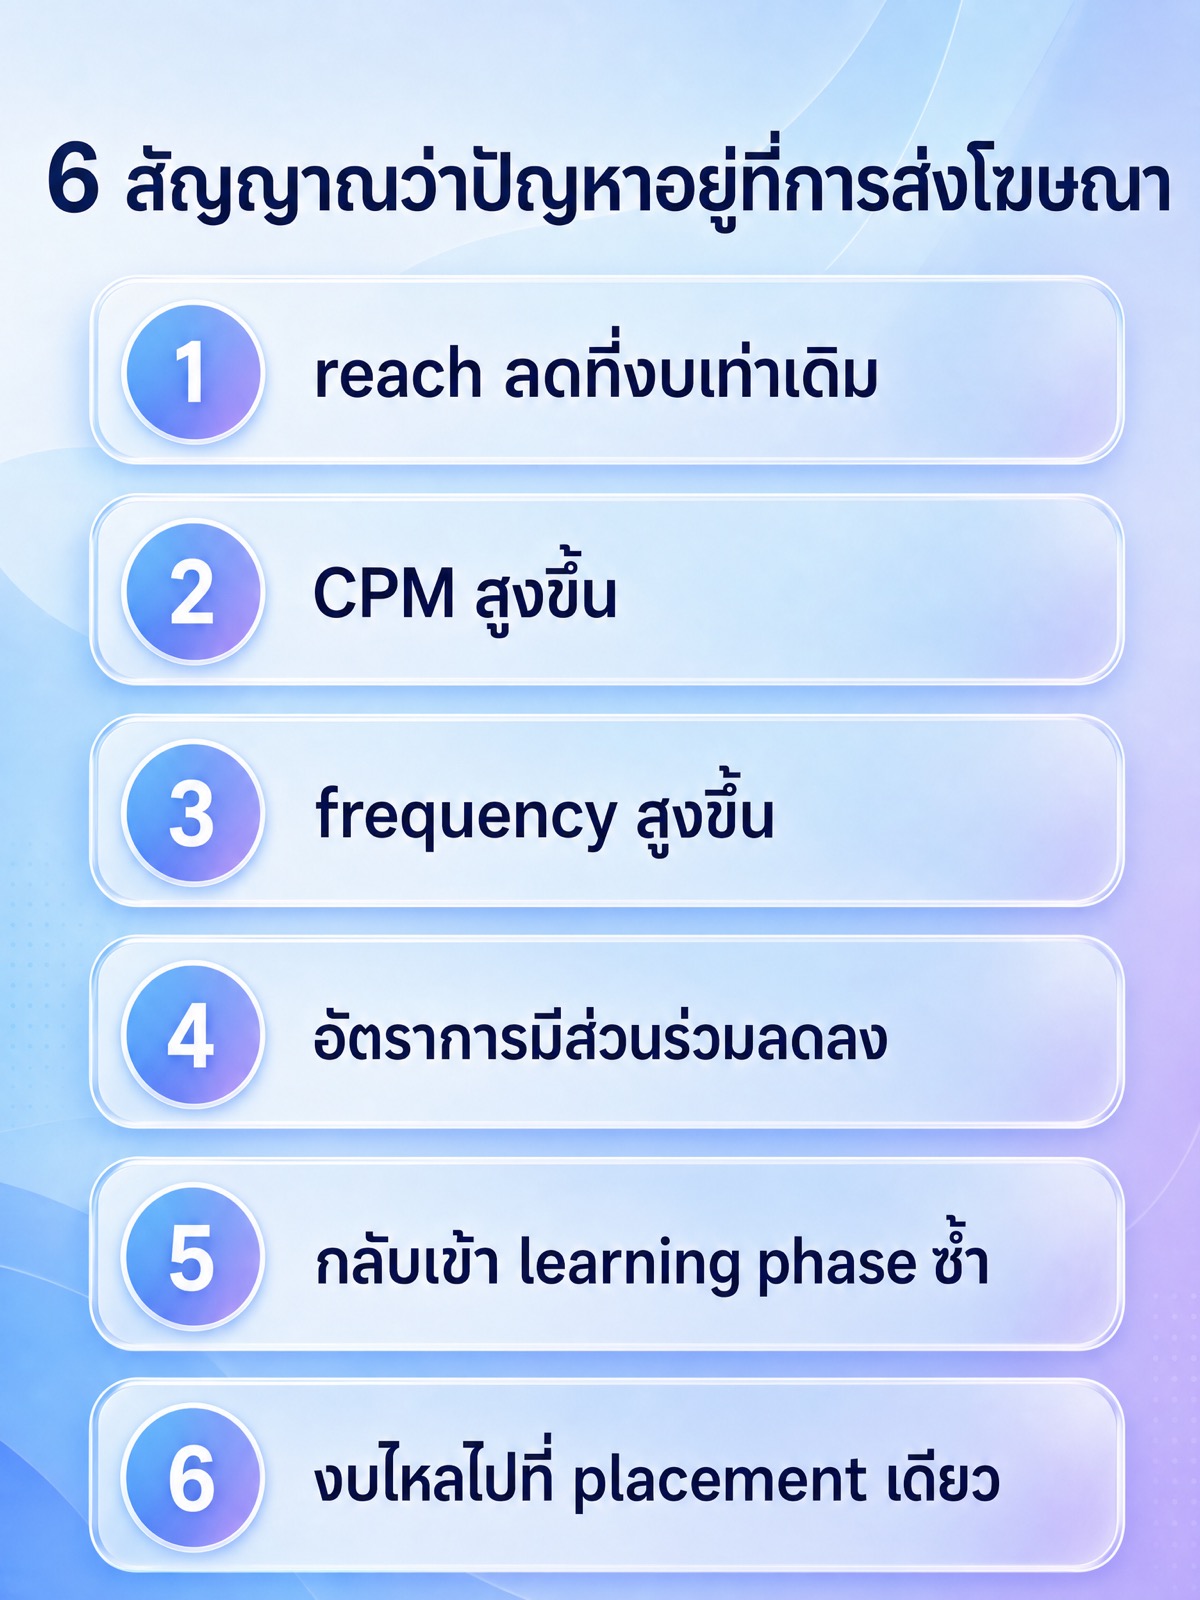
- Six columns show delivery is the cause: reach at flat spend, CPM, frequency (impressions divided by reach), unique click rate, the delivery column reading learning or learning limited, and impressions piling into one placement.
- Use the identity results = impressions x click rate x destination rate, and impressions = budget / CPM x 1000, over two periods. Whichever term moved names the layer that broke.
- No reliable public benchmark exists for Thai CPM or reach. Pull Ads Manager breakdowns by placement, age and platform over your trailing 90 days and use that as the only baseline.
If the same campaigns, the same audiences and the same creative are producing less every month, the most likely cause is not your offer. It is that Meta's delivery system is now choosing a different set of people to show your ads to, at a different price. This happens without anything in your account being broken, because delivery decides who sees an ad by comparing your ad against every other ad competing for the same person at the same moment, and when that comparison changes, your reach and your CPM change with it. This article is a diagnosis, not a trend list. It walks through the five parts of the delivery system that decide who sees your ads, the six columns in Ads Manager that tell you delivery is what shifted rather than your offer, and the eight changes that actually move the number back.
Before you blame delivery, rule out two basic causes
Rule out two things first. One, does the campaign objective match the result you actually count? If you told the system to find people who click and you are grading it on orders, it is doing what you asked and not what you want. Two, are the events you optimise on still arriving in full? Open Events Manager and check that the event your campaign optimises for keeps a steady daily count instead of dropping to zero on some days. Until those two are stable, every other number in this article is unreadable. Once they are clean, move to the delivery system and your creative supply, which is what the rest of this article is about.
Facebook algorithm 2026: the five parts of delivery that decide who sees your ad
What people call the facebook algorithm 2026 is not a rulebook you can open anywhere. What you can read is your own account. The auction is short to describe: every time one ad slot opens for one person, the system ranks the competing ads by a total value made of three parts, which are the price you are willing to pay, the system's estimate of how likely that person is to take the event you optimise for, and quality and relevance signals attached to the ad itself. Every feeling that "the algorithm changed" reaches you through one of those three terms. The five items below are where the pressure shifts most often, and each one has a place you can click in your own account.
- Advantage+ structures are the default path, not an experiment. When you build a new campaign, the interface offers a structure that folds everything into one unit and hands several decisions to the system by default, including which placements to use, how far to expand past the interests you named, and how to move budget between ad sets. That means a campaign you built months ago and a campaign you duplicated last week can be configured differently without you changing anything by hand. To check, open each ad set and read the state of every toggle under audience and placements one by one, comparing an old ad set with a new one so you see it with your own eyes.
- The feed gives more room to vertical video. Reels and Stories placements are full screen, vertical and sound on. If the only file you upload is a square still image, your ad is not eligible for that group of surfaces at all, so the number of auctions you can enter shrinks by itself, with no warning message anywhere. To check, switch to reporting, open Breakdown and select the breakdown by placement to see where your impressions are concentrated, then use placement asset customisation to add a vertical aspect ratio to the ad you already have.
- Weight sits on meaningful interaction. Content ranking favours what people stop on, comment on, share or save over what they scroll past. On the ads side, that weight arrives through the estimated action rate and the quality signals in the auction, which means an ad people scroll past can lose to an ad people stop on even when it bids more. To check, add the quality ranking, engagement rate ranking and conversion rate ranking columns to your table. They appear once an ad has accumulated enough impressions, and they read as a comparison against other ads competing for the same audience, not as an absolute score.
- Signals are consolidated across platforms. One dataset is shared across Facebook, Instagram, Messenger and WhatsApp, and system-chosen placements can serve into all of those surfaces. A conversion credited to your campaign can therefore arrive from a surface you did not consciously buy, and results going quiet on one surface can make your total look like a decline when you changed nothing. To check, use the platform breakdown alongside the placement breakdown, and confirm in Events Manager that the dataset connected to your ads is the same one across every channel.
- The system prefers a large pool of creative over a few hand tuned pieces. Once placement selection and audience expansion are handed to the system, the lever left in the advertiser's hands is supply, meaning the number of distinct concepts, opening hooks, aspect ratios and lengths. The tools that match this are the flexible ad format and dynamic creative, which let you load several files and several texts into one ad and let the system pair them. The caution is that stuffing many ads into one ad set splits the optimisation events across them until no single piece has enough data behind it.
Advantage+: which settings it means, and where your budget goes
Advantage+ is not one button. It is the name of a family of settings spread across different levels of the campaign. What makes it confusing is that each setting changes delivery behaviour in a different way, and several are on by default without anyone pressing anything. These are the ones worth knowing by name and location.
- Advantage+ placements sits at ad set level under placements. The alternative is choosing placements manually.
- Advantage+ audience and detailed targeting expansion sit at ad set level under audience. They reach beyond the interests you named when the system predicts a better result.
- Advantage campaign budget sits at campaign level. It moves budget to whichever ad set the system predicts will perform, which means other ad sets can end up spending almost nothing.
- Advantage+ creative sits at ad level. These are automatic adjustments such as brightness, frames, music or text changes, which alter the ad people actually see compared with the file you uploaded.
The complaint people voice most often is that budget flows somewhere they did not choose, and that is readable in two places. First, at ad set level, look at the amount spent column and see whether one ad set is eating almost the whole budget. Second, open the placement breakdown and see whether impressions are concentrated in a single placement. The surface with the cheapest cost per impression is usually the easiest one to absorb budget, and it is not necessarily the surface that closes sales. The test that gives you a readable answer is to split out one ad set with manual placements, give it enough budget, let it finish the learning period, then compare its cost per result against the ad set that lets the system choose. Do not compare across wildly different periods, and do not judge before the new ad set has left learning.
Why facebook ads went quiet: six signals that delivery is the problem
Quiet usually means three things at once: fewer people see you, fewer people message you, and each result costs more. These six signals separate delivery as the cause from an offer people stopped wanting. Read all six together rather than one at a time, because any single one on its own has several explanations.
- Reach falling at flat spend. Set the date range to the last 30 days, turn on the comparison with the previous period in the date selector, and read the amount spent column next to the reach column. If spend is flat while the number of people reached falls, the same money is buying fewer people. That is the entry symptom that points at delivery.
- CPM climbing. CPM is the cost per one thousand impressions. If it rises while you changed nothing, there are two explanations: more advertisers are bidding for the same people, or your ad is winning fewer of the cheap auctions because its estimated action rate and quality signals dropped. Those two are not fixed the same way, so read the next item alongside it.
- Frequency rising. Frequency is impressions divided by reach, meaning the average number of times one person sees your ad. If it climbs while the number of people reached shrinks, you are paying to show the same group the same ad again. An eligible audience that is too small relative to your daily budget is the most common cause of this pattern.
- Engagement rate falling. Read unique click through rate together with the quality ranking and engagement rate ranking. If the click rate drops while frequency rises, that reads as creative fatigue with that audience rather than a product nobody wants.
- Re-entering the learning phase repeatedly. The learning period ends once an ad set accumulates roughly fifty optimisation events within a window of about a week. Significant edits, such as a large budget change, a change of audience or a change of the event you optimise for, reset it. Read the status in the delivery column: if it permanently says learning, or says learning limited, that ad set never gets enough data to settle, and your editing it every other day is part of the problem.
- Budget flowing into one placement. Open the placement breakdown. If nearly all impressions pile into one placement that was never the one producing results, system-chosen placements are deciding for you, and the campaign average is hiding it.
Once you have read all six, lay out this simple identity to point at the layer that broke. Results equal impressions multiplied by click through rate multiplied by the rate at which people who clicked do what you want on the destination, and impressions equal budget divided by CPM multiplied by one thousand. All four numbers are already in your table or can be computed from it. Put two periods side by side and see which one moved. If only CPM moved, the issue is delivery and the auction. If the click rate moved, the issue is creative and who is being shown it. If the destination rate moved, the issue is the page or the offer. That pass takes under twenty minutes and removes almost all of the guessing.
Facebook ads reach dropping: read the columns properly first
Half of all conclusions that facebook ads reach is dropping come from reading the wrong column. Before you change anything in the account, settle the definitions, because these numbers look alike and answer different questions.
- Reach is the number of unique accounts that saw the ad at least once. Impressions is the number of times the ad appeared on a screen. The second can keep growing while the first does not move at all.
- Frequency is not a value you set in an ordinary campaign. It is the output of impressions divided by reach. A frequency cap is available only on campaigns optimised for reach.
- Reach broken down by placement does not add up to total reach, because one person can see your ad in the feed and in Reels. Adding the broken-out figures always gives you an inflated picture.
- The attribution window changes the number of results you see without changing actual sales by one baht. If somebody on the team edits it, the report looks like an immediate collapse while the business is unchanged. Check this before you panic.
- Cost per result depends on which result you chose to count. Changing the counted event mid-flight breaks the line and makes historical comparison impossible.
One more caution: the campaign average hides everything. A campaign that looks merely flat is usually one placement still working and another doing badly. Opening the breakdowns is the first job every time, not the last.
What the Meta ads algorithm wants is volume of creative, not one perfect asset
With audience and placement selection largely handed to the system, what the Meta ads algorithm still needs from you is raw material, meaning pieces different enough that it has something to pair with each group of people. There is a line here that people confuse often, between concepts and variants. A concept is a different reason somebody should buy, such as price, speed, safety or solving an immediate problem. A variant is a reshaping of the same concept, such as a new three second hook, a different aspect ratio, a different length or a different presenter. Most quiet accounts have plenty of variants and one concept. The result is the same people seeing the same story in new clothes, and frequency climbing exactly as described in signal three above.
Creative refresh cadence should be tied to a number, not to the calendar. Watch frequency and unique click through rate per ad. When frequency climbs and the click rate softens at the same time, that is the signal to push a new piece in, not the end of the month. What you need ready is a library that carries a vertical aspect ratio for full screen surfaces and a feed ratio in the same set of files, so the ad never loses eligibility on one surface. For many accounts the real bottleneck is a team that cannot produce fast enough rather than a setting, and if that is the case, image and video production capacity is what to fix first. Graphic design services cover that kind of work.
Two details that genuinely help. First, many people in Thailand watch video with the sound off in the feed but with sound on in short video surfaces, so a piece has to read both ways, which means Thai captions burned into the frame rather than left in the post text. Second, Thai text is almost always longer than English text carrying the same meaning. Copy that fits a square image will overflow or shrink past legibility once it is cut down for a vertical surface, so check the work on a real phone before every upload.
Eight changes that actually work when delivery shifts
- Raise the volume and variety of creative. Count how many new concepts you shipped last month, not how many files. Aim to have several genuinely different concepts running at once, each with its own variants. That gives the system something to pair with several groups of people instead of pushing one story at everybody.
- Make vertical video the default. Still images still work. The point is that full screen surfaces need a vertical file before they will serve your ad at all, so produce the vertical file first and cut it down for the feed, which is easier than working the other way round.
- Wire first-party data in properly. Send events from your server through the Conversions API alongside the browser, use the same event identifier on both paths so nothing is double counted, verify your domain, prioritise your web events within the limits of aggregated measurement, and open the event match quality score for each event in Events Manager to see whether what you send is enough to match people at all.
- Go broader on targeting while feeding better signal. Stacking interest layers makes the audience small, pushes frequency up fast and makes the learning period hard to finish. The approach that fits the current system is broad at the audience level, with precision coming from accurate events and from creative that selects its own audience through its content.
- Fix the offer and the destination. If the term that moved in the identity above is the destination rate, more budget changes nothing. Check mobile page speed, whether what the ad promised matches what the first screen of the page shows, and how many fields the form has. For many Thai buyers a chat destination outperforms a form, so test both with measurement that can be compared.
- Set refresh cadence by numbers. Write the rule in advance: when frequency reaches the level at which you have previously seen click rate start to slip, a new piece goes in immediately. There is no industry figure to copy for that level. You read it out of your own account history.
- Build measurement that survives signal loss. Do not let platform numbers be your only source of truth. Pull closed revenue from your back office or CRM and reconcile it against what the platform reports on a schedule, and for big decisions use a test with a group that is held out from seeing the ads, or a geographic comparison, both of which stay readable when attribution is incomplete. If you need to buy media outside Meta to reduce dependence on one channel, programmatic advertising can be planned alongside it.
- Consolidate structure so events concentrate enough to learn. Ten ad sets splitting small budgets usually means no ad set accumulates enough events to leave learning. Merge the overlapping audiences, cut the number of ad sets, and give each one enough budget to reach the line, then split again later when you have more data. If the missing revenue sits with people who enquired and did not buy, remarketing services are the layer that chases them back, and if you are running Facebook alongside other social channels at the same time, social media advertising services cover that part of the work.
A table of symptom, column and meaning
This table compresses the diagnosis onto one page. Use it when you open Ads Manager and do not know where to click first. Every cell refers to something that exists in your own reporting view. There is no industry standard to compare against here, because the thing to compare against is your own account history.
| Symptom you see | Where to look in Ads Manager | What it usually means |
|---|---|---|
| Spend flat, fewer people reached | Amount spent column next to reach, with period comparison on in the date selector | The same money buys fewer people. Read CPM next. |
| The same people again, no new ones | Frequency column, which equals impressions divided by reach | Eligible audience too small for the daily budget, or creative fatigue with that group |
| Results fell and you changed nothing | Status in the delivery column: learning, or learning limited | Edits reset the ad set's learning and it never gathered enough data to settle |
| Cost per result up across the campaign | Breakdown by placement, and breakdown by platform | Impressions moved into a placement that never closed sales, and the average hides it |
| Reported numbers collapse in one day | Attribution window setting, and event counts in Events Manager | A measurement problem, not a delivery problem. Finish checking before touching budget. |
Thai user behaviour on Facebook in 2026: read your own breakdowns
Plenty of articles quote figures about Thai user behaviour on Facebook in 2026, but plainly stated, no reliable public benchmark exists for Thai CPM or reach that is solid enough to make real budget decisions against. The only usable baseline is the trailing ninety days of your own account, because it is produced by your products, prices, locations and timing. Whenever you see a market figure in an article, use it to raise a question, not as a target.
Pulling that data takes a few steps. Open Ads Manager, set the date range to the last ninety days, turn on the comparison with the previous period so you have two blocks side by side, then open Breakdown and pull three views separately. The first is the breakdown by placement, to see whether your share of impressions has moved from the feed to short video surfaces. The second is the breakdown by age, to see which way the age composition of the people seeing your ads shifted between the two periods. The third is the breakdown by platform, to see how much delivery went to Facebook, Instagram or Messenger. Export each one and keep it every quarter, and you will own a baseline nobody in the market can hand you.
What Thai advertisers commonly see in those three views can be written without a single figure attached. The placement view usually says user attention has moved further toward vertical short video, while the feed still does the work of the place where people read detail and decide. The age view usually says the people still spending time in the feed skew older than the people living in short video, which bears directly on your choice of imagery, type size and tone of voice. The platform view usually says the Thai buying path ends in a chat rather than in a form, because questions about price, timing and conditions always come before a decision. All three of those you can verify in your own account within half an hour, and if your account says otherwise, believe your account.
Three pieces of real work follow. First, every ad needs both a vertical file and a feed file inside it, so it never loses eligibility on the surface people moved to. Second, Thai captions have to be legible on a small screen. Thai script carries vowel marks above and below the line that collide once type is shrunk, so the font and size need testing on a real device. Third, if the destination is a chat, somebody has to answer within the time Thai buyers expect, because an ad that works well with a slow reply shows up in the report as a higher cost per result even though the damage is happening in the back office.
FAQ: common questions about the facebook algorithm 2026
What exactly is the facebook algorithm 2026?
It is a collective name for Meta's content ranking and ad delivery systems in the version you are using right now, not a rulebook with a version number you can open. What you can verify is the three-part auction mechanism, meaning the price you are willing to pay, the estimated action rate and quality signals, plus what your own account reports in each column. When somebody tells you a specific rule changed in a specific month, ask for evidence before believing it.
Should I switch all Advantage+ settings off?
Not all of them, and not without testing, but you should know which ones are on and what each one does. The readable approach is to test one at a time, for example running one ad set with manual placements against one that lets the system choose, giving it enough budget and waiting for the learning period to finish before judging. Turning everything off at once usually raises cost in the short term and leaves you unable to say which setting caused what.
Reach dropped but sales are flat. Do I need to fix anything?
If cost per result and closed revenue are both steady, there is nothing to fix yet. Falling reach with steady revenue often means the system is cutting out people unlikely to buy, which is good. What to watch is frequency: if it keeps climbing, revenue tends to follow it down within a few weeks, because an audience seeing the same ad repeatedly runs out of response.
What CPM is normal for the Thai market?
That number does not exist in any form you can trust. CPM depends on your audience, the season, how many advertisers are bidding for the same people, the placement and the quality of your creative. Figures people share come from accounts whose conditions you do not know. Use your own account's trailing ninety day average as the baseline and read changes against that line. It is the only number you can decide with.
How many days before I can judge a new creative?
Wait until that ad set has accumulated enough optimisation events to leave the learning period, and the system's threshold sits at roughly fifty events within a window of about a week. If your daily budget cannot reach that line, reading results on day two is reading coincidence, and editing every other day resets learning again until no data set is ever complete.
Where to start
The order that saves the most time is this: finish checking measurement, then open the breakdowns by placement, age and platform to see where delivery moved, then lay out the four-term identity to point at the broken layer, then do the work on creative supply and campaign structure rather than on raising budget. If you have read the numbers in your account and still cannot tell whether the symptom comes from delivery or from the offer, the team behind Relevant Audience's Facebook Ads service reviews accounts and sets the fix order using the data your account already holds.