Ask any marketing team what their biggest data headache is, and separating branded from non-branded traffic usually comes up pretty fast. Google Search Console just made that significantly easier.
The branded queries filter is now available to all eligible sites, giving marketing teams native segmentation without the manual workarounds that used to eat up hours of work. This post walks through what the feature does, how to use it, and what insights you can actually pull from it.

- What is the branded queries filter in Search Console?
- Why this matters for marketing teams right now
- How to put the branded queries filter to work for your team
What is the branded queries filter in Search Console?
This is one of the more genuinely useful things Google has added to search console in recent memory. It lets you segment search performance data by branded versus non-branded query groups, all inside the native interface.
No third-party tools. No regex gymnastics. Just filtered data from your search performance report.
Where to find it in the Performance report
Open the Search Results Performance report and look for the new filter that lets you toggle between branded, non-branded, or all queries. Switch segments and your impressions, clicks, CTR, and average position data all update accordingly.
If you’re already comfortable with the existing filter options in the Performance report, this one fits right in. No steep learning curve.
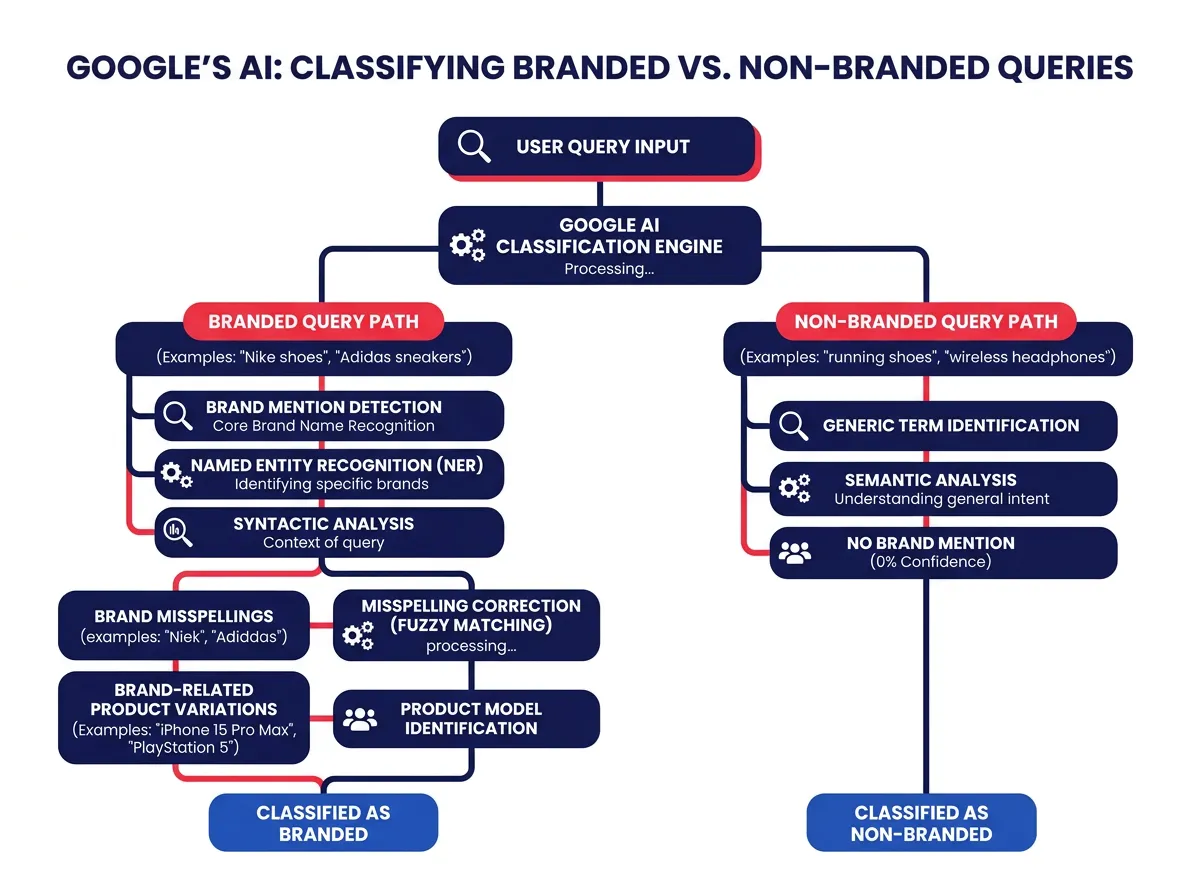
How Google classifies branded vs. non-branded queries
Google uses an AI-assisted system to handle classification. It looks at your verified site and identifies queries that include your brand name, common misspellings, product names tied to your brand, and variations across languages.
That last part matters more than it sounds. Branded keywords don’t always show up cleanly. People misspell your name, abbreviate it, add a product suffix, or search in a different language entirely. Manual regex filters have always struggled with that kind of variation. The AI classification catches it automatically, which is a real improvement over the old way of doing things.
Why this matters for marketing teams right now
Brand measurement has always been awkward. Awareness campaigns drive results that are genuinely hard to connect back to search data. This filter helps close that gap a little.
From manual regex to native segmentation
Before this, most teams relied on manual regex filters inside search console or exported data into Looker Studio to build custom segmentation. That process was slow, and one bad regex pattern could quietly misclassify queries and mess up your entire dataset without you realizing it.
The native filter removes that problem. Classification happens automatically, updates consistently, and requires no setup or ongoing maintenance. For anyone who reports on branded versus non-branded performance on a regular cadence, that’s a real time save.
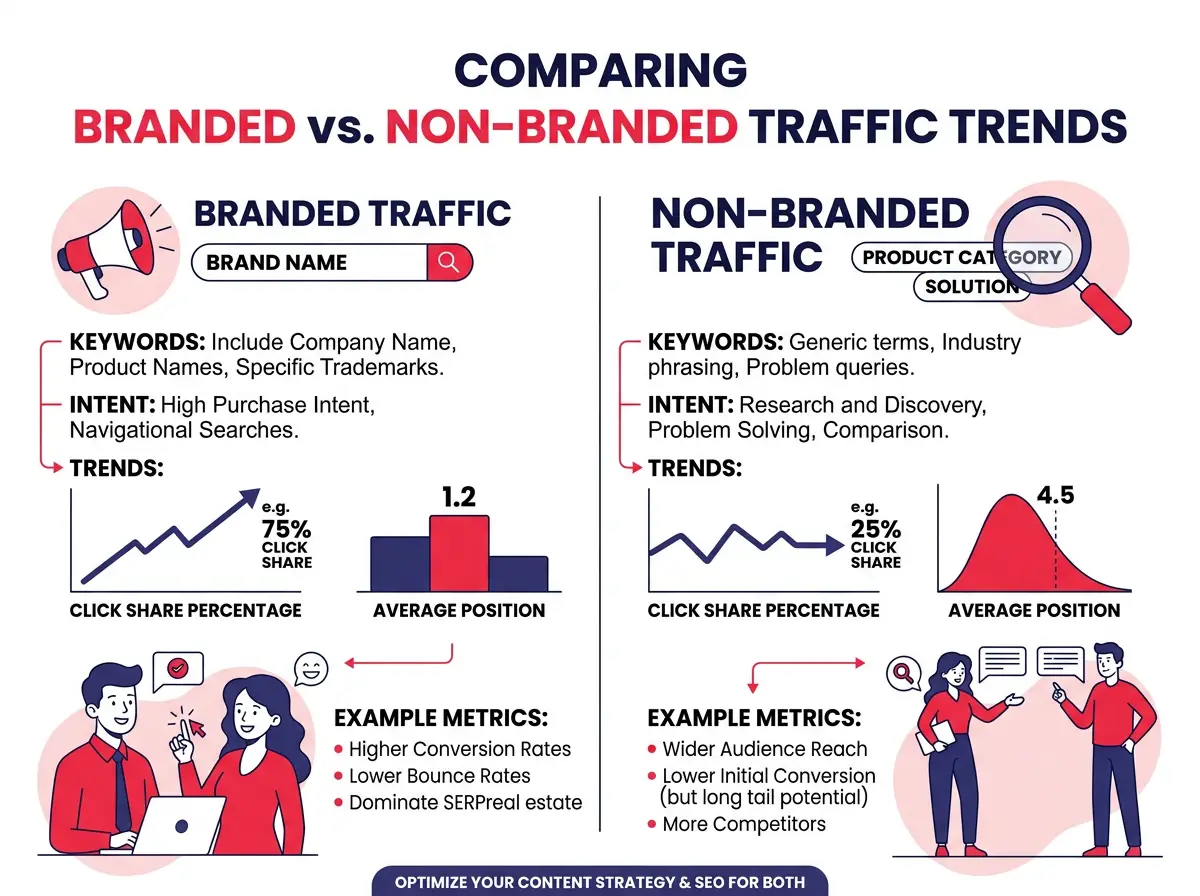
Measuring brand demand vs. discovery traffic
The Insights report card that comes with this update shows a click breakdown between branded and non-branded traffic. It’s a quick way to see how much of your search traffic comes from people who already know you versus people finding you for the first time.
That ratio is worth tracking over time. Growing branded traffic suggests your awareness efforts are landing. Non-branded clicks staying flat while branded climbs might point to a Content Marketing or SEO gap. Neither conclusion is automatic, but the trend data gives you something concrete to investigate rather than just guessing.
How to put the branded queries filter to work for your team
Clean data is only half the job. Here’s what to actually do with it.
Setting a baseline for brand vs. non-brand traffic
Before any major campaign or content push, snapshot your current branded versus non-branded traffic split. Write down your click volumes, impressions, and average positions for both segments. This is your reference point for everything that comes after.
It answers a basic but important question: what does normal look like? Once you have that, shifts in your data become much easier to read. A spike in branded impressions after a product launch means something specific when you can compare it to documented pre-launch numbers. Without a baseline, you’re mostly speculating.
If you have historical data in search console, use the date comparison feature to look back at earlier periods and build out a longer trend line. Even a few months of context helps you separate seasonal patterns from genuine movement.
Using the data to inform content and campaign decisions
Non-branded query data is where your content team should focus most of their attention. Filter the Performance report to show only non-branded queries and look at which topics are pulling impressions but not clicks. Those are gaps. Pages that rank but don’t earn clicks usually have title tags or meta descriptions that don’t match what the searcher actually wants.
On the campaign side, branded query trends work as a rough proxy for awareness impact. Run a big paid social or Display Advertising push, then watch your branded search impressions over the following weeks. An uptick in branded queries after a campaign often means your messaging reached people and they followed up by searching for you directly.
You can also use branded keyword data to find terms worth targeting with Google Ads. If certain branded combinations generate solid impressions but weak average positions, a modest paid investment there can help you hold traffic that might otherwise go to a competitor bidding on your brand name.
The filter isn’t magic, but it gives you cleaner data and faster answers than the workarounds most teams have been relying on. Start with a baseline, track how the split changes over time, and let that guide where you put your content and campaign energy.