TL;DR
- Productrise tracked more than 2 million product listings over 23 days, from 9 August to 31 August 2026, in the United States and the United Kingdom, running the same shopping queries through Google AI Mode and traditional search on the same day.
- Where the same product appeared on both surfaces for the same query on the same day, the lead price in AI Mode averaged 21.6% higher than on the results page. PPC Land reported the study on 3 September 2026.
- Only 1.28% of products ranking in traditional search also appeared in AI Mode for the same search on the same day: 27.8 products per query against 3.9, with 0.94 in common.
- Across all priced listings the median AI Mode product was $149 against $100 in traditional search, roughly 49% higher, a comparison of what each surface stocks rather than of the same item.
- The study did not say why AI Mode shows higher-priced offers, did not measure clicks or revenue, and covered no Asian market.
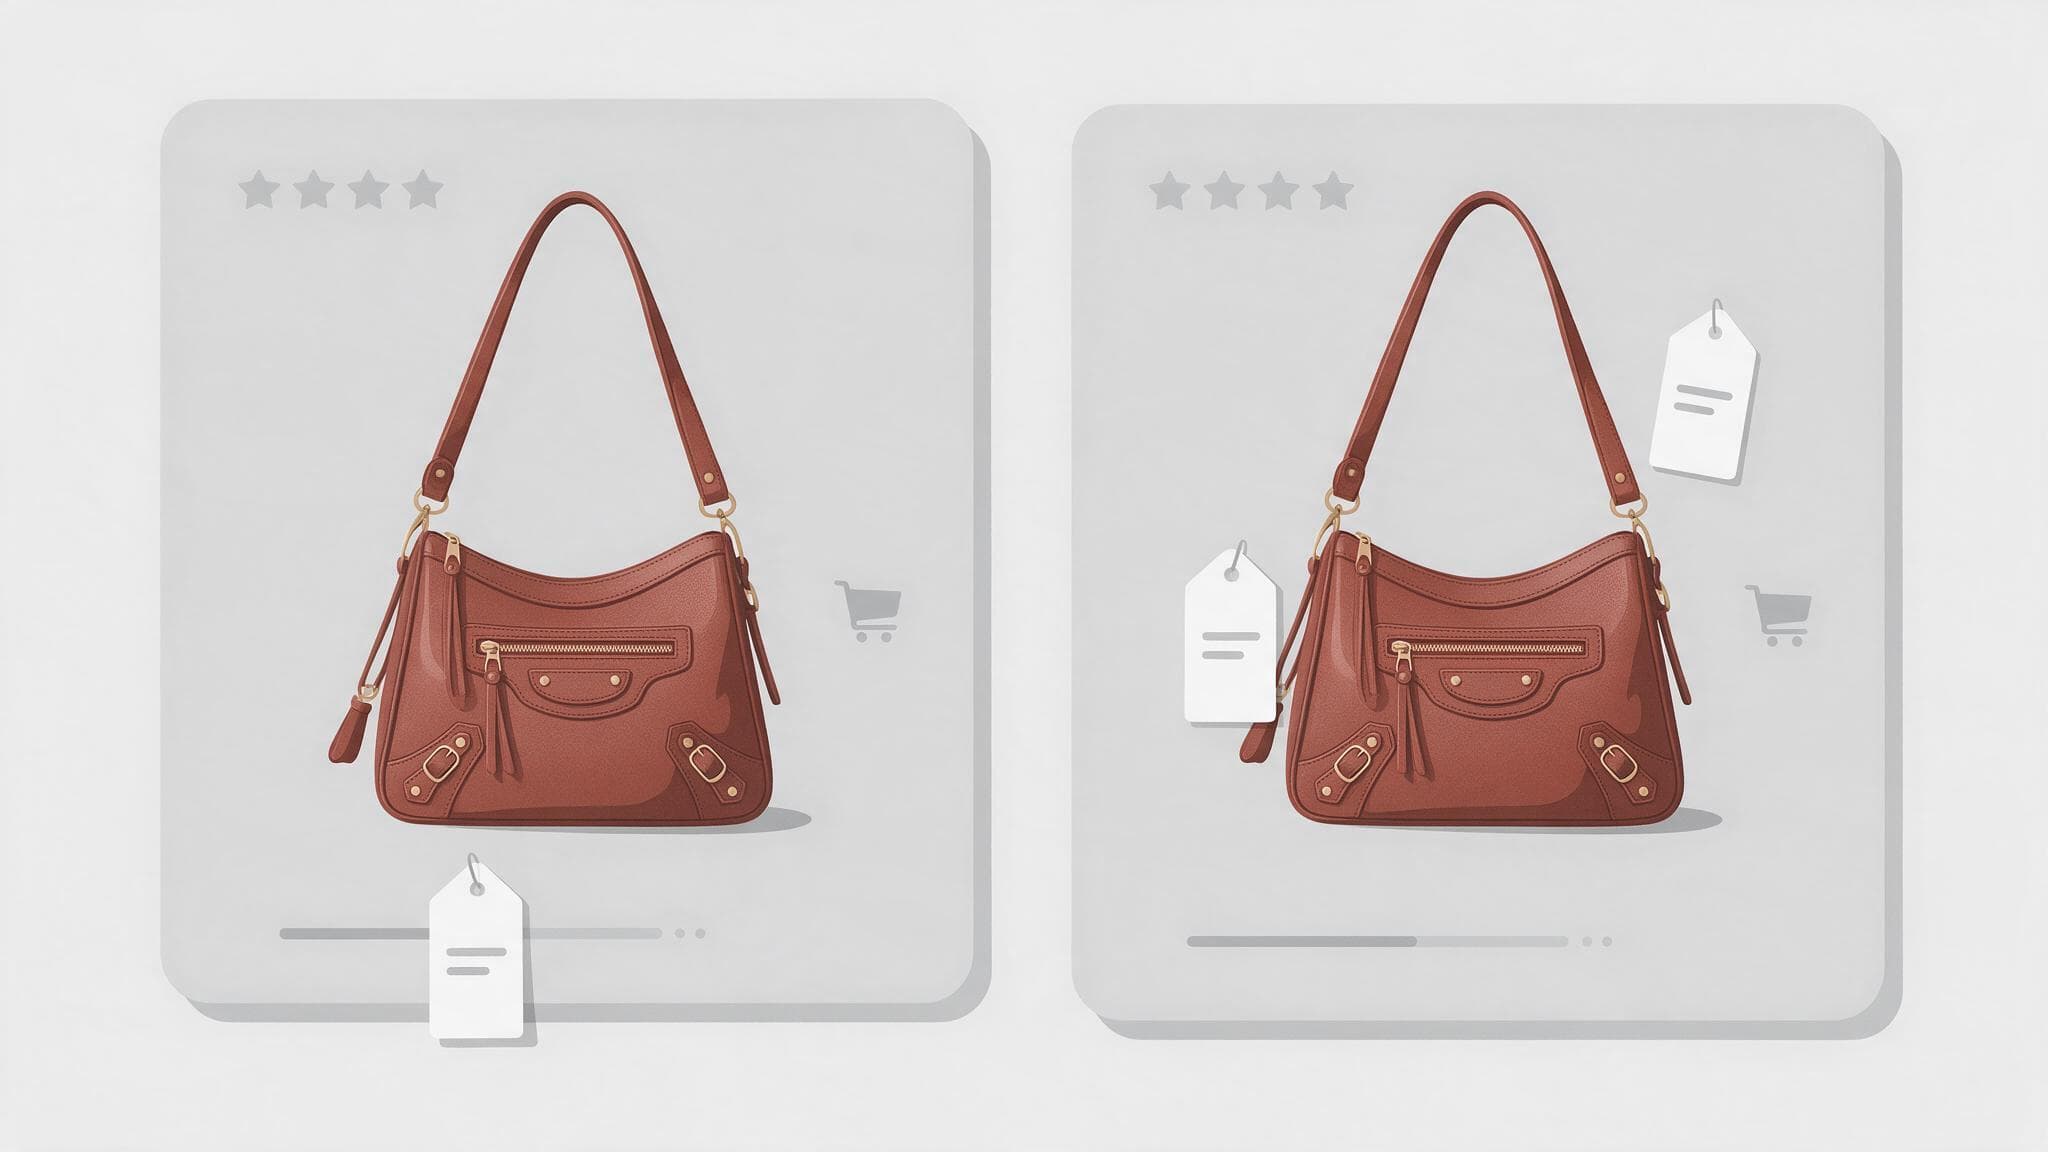
A study of more than 2 million product listings found that when the same product shows up in both Google AI Mode and traditional search on the same day, the price attached to it in AI Mode is 21.6% higher on average. The study was published on 1 September 2026 by Hugo Huijer, founder of the product-visibility tracking platform Productrise, and PPC Land reported the findings on 3 September 2026.
The second finding in the same dataset is arguably the larger one: the two surfaces almost never show the same products. Only 1.28% of products ranking in traditional search also appeared in AI Mode for the same search on the same day. Whatever AI Mode is, it is not a reformatted version of the results page a merchant already ranks on.
What Productrise measured, and how
Productrise tracked more than 2 million product listings over 23 days, from 9 August to 31 August 2026. It ran product-centric shopping queries through Google AI Mode and through traditional search on the same calendar day and logged what each surface returned. The dataset covers more than 100,000 results pages and AI Mode responses in the United States and the United Kingdom.
The method matters for reading the headline number correctly. On the traditional search side, only listings inside the popular_products carousel were analysed, which is the free product block that appears in standard results. On the AI Mode side, all tracked AI Mode product cards were used. Products were matched using Google's stable product identifier where one was present, and matching was restricted to the same query on the same calendar day.
For each matched pair, the study took the lead offer on each side, meaning the listing in the lowest position, and measured the difference as the AI Mode price minus the results page price, divided by the results page price. United States prices are reported in dollars and United Kingdom prices in pounds, with no currency conversion applied between them.
The 21.6% figure describes the first price you see, not the cheapest one
This distinction is the one most likely to get lost when the number travels. The 21.6% gap describes the first offer a shopper sees attached to a product, not the cheapest offer available for that product. Clicking a product on either surface opens a sidebar panel that lists other sellers and their prices, and some of those are cheaper.
So the study is about what happens before that click, which most shoppers do not make. That framing is what makes the finding commercially interesting and also what limits it. It is a statement about the default price a surface presents, not a claim that AI Mode hides cheaper offers or that the product costs more when bought through it.
The report does not say why AI Mode surfaces higher-priced offers. The selection mechanism behind which seller becomes the lead offer on the AI surface is unexplained in this research, and no explanation should be assumed from the size of the gap.
The numbers in one place
Every figure below comes from the Productrise release as reported by PPC Land, and each one describes a different comparison, so they are not different ways of saying the same thing.
| What was measured | Result |
|---|---|
| Lead price on matched products, AI Mode against traditional search | 21.6% higher on average in AI Mode |
| Median price across every priced listing on each surface, including products appearing on only one | $149 in AI Mode against $100 in traditional search, roughly 49% higher |
| Share of all tracked products that appeared in AI Mode | 12.3% |
| Products returned per query | 27.8 in traditional search, 3.9 in AI Mode, 0.94 in common |
| Products ranking in traditional search that also appeared in AI Mode for the same search on the same day | 1.28% |
Two price comparisons, two different things
The 21.6% and the roughly 49% in that table answer different questions and should never be quoted interchangeably. The 21.6% is a like-for-like comparison: same product, same query, same day, lead offer against lead offer. It isolates the price difference for a product that appears on both surfaces.
The broader analysis across every priced listing on each surface, including products that appeared on only one of them, found the median AI Mode product priced at $149 against $100 in traditional search. That is a comparison of what each surface stocks rather than of what each surface charges for the same item. A shelf holding more expensive products will produce a higher median without any single product being repriced.
Read together, the two figures suggest something that the report does not state as a mechanism and neither will this article: AI Mode both shows different products and shows higher lead prices on the products it shares with the results page.
AI Mode is a much smaller shelf
In this dataset AI Mode accounted for 12.3% of all products tracked, an average of 3.9 products per response against 27.8 in traditional search. In absolute terms, the average query that produced results on both surfaces returned 27.8 traditional search products, 3.9 AI Mode products, and 0.94 products in common. Less than one product per query overlaps.
The overlap rate itself was calculated per day, dividing matched products by all traditional search listings carrying a product identifier, then averaging the daily rates. That gives the 1.28%. A number that small changes the question a merchant should be asking. Ranking well in the popular_products carousel is close to no evidence at all about whether the same product appears in AI Mode.
How this sits against the earlier Productrise work
Productrise ran an earlier study over 21 days in July 2026 which found AI Mode returned roughly 95% fewer product listings than standard search. Standard search returned products on about 88% of tracked queries against roughly 23% for AI Mode, and product overlap was reported at 0.8%. The new release describes that July work as having found AI Mode ranking about 5% of the products that rank in traditional search overall, which is a volume ratio rather than an overlap rate.
The two studies use separate datasets and different denominators, so the 0.8% and the 1.28% are close but not directly interchangeable. Two readings taken with different methods that land near each other are worth noting; they are not a trend line, and presenting them as a rise in overlap would be wrong.
What the research does not cover
Several limits belong next to the headline. The study did not measure conversions, clicks or revenue. It measured what the two surfaces displayed, which is a different question from what shoppers did about it. It also did not say whether Google intends this behaviour or considers it a defect, and Google is not quoted in the reporting.
The dataset covers the United States and the United Kingdom. It did not cover Thailand or any Asian market, so nobody can say the price gap has been measured here. Twenty-three days is a short window, and a promotional cycle inside it would be invisible in an average.
Finally, this is one company's dataset rather than an independent audit, and Productrise sells a product built on tracking exactly this surface. That does not make the numbers wrong, and the method is described in enough detail to be argued with, which is more than most vendor research offers. It does mean the finding wants independent replication before it becomes a planning assumption.
What a merchant can check in their own account
This section is analysis rather than reporting. The first question is basic and most merchants have not answered it: do your products appear in AI Mode responses at all for your head queries? Run the query yourself, look at what the AI Mode product cards contain, and record whether your item is there. Do that separately from your results page checks, because the two surfaces are now demonstrably drawing from different sets.
The second question is whose offer is showing. If your product does appear, check whether the listing carries your own store as the seller or a reseller, because the lead offer is the price a shopper judges the product by, and it may not be yours. Merchant Center feed hygiene sits underneath both questions: stable product identifiers are what allowed this study to match products across surfaces at all, and they are what allows Google to recognise your item as the same product a competitor is also selling.
The study's own argument is that lowest price may no longer be a safe route to visibility on the AI surface, since the lead offers it showed were higher on average. State that as the study's argument, because it is. Nobody has established the selection rule, and building a pricing strategy on an unexplained correlation from a 23-day panel would be a mistake.
The 1.28% overlap is the number that should reshape planning. It makes AI Mode a separate shelf rather than a different skin on the same one, and separate shelves need their own diagnostics: their own visibility checks, their own titles and attribute quality reviews, and their own place in a reporting line for ecommerce marketing rather than a footnote inside the search report.
What this means for Thai marketers
Nothing in this research was measured in Thailand. The dataset is United States and United Kingdom, and Thai merchants should treat the 21.6% figure as a finding from those markets rather than a local benchmark. The useful part is the method, which any team can run at small scale: pick your twenty most valuable product queries, run each through both surfaces on the same day, and log what came back and at what price.
That exercise takes an afternoon and answers a question that no dashboard currently answers for Thai stores. If your products are absent from AI Mode responses on the queries that matter, that is a feed and identifier problem to investigate rather than a ranking problem, and it belongs alongside the rest of your generative engine optimisation work rather than inside your paid search reporting.
For merchants on Shopify, the practical lever is the same one that has always fed the product surfaces: identifiers, titles and attribute completeness flowing cleanly into Merchant Center, which is a large part of what Shopify SEO work involves once the storefront itself is sound. The surface changed. The data quality that feeds it did not.
FAQ on the Productrise AI Mode price study
Does this mean products cost more if I buy them through AI Mode?
No, the study measured the first offer displayed, not the cheapest one available or the price actually paid. Clicking a product on either surface opens a sidebar panel listing other sellers and their prices, some of them cheaper, and the research is about what a shopper sees before that click.
Why does AI Mode show higher-priced offers?
Neither Productrise nor PPC Land said why, and the selection mechanism is unexplained. Google is not quoted in the reporting, and there is no statement about whether the company intends this behaviour or regards it as a defect.
Was any of this measured in Thailand?
No. The dataset covers the United States and the United Kingdom over 23 days from 9 August to 31 August 2026, with no Asian market included and no currency conversion applied between dollars and pounds.
If I rank well in Google Shopping results, will my product show in AI Mode?
Not reliably: only 1.28% of products ranking in traditional search also appeared in AI Mode for the same search on the same day. The average query returned 27.8 traditional search products and 3.9 AI Mode products, with 0.94 in common.
How much should I trust one vendor's dataset?
Treat it as a well-documented single-source finding rather than a settled fact. Productrise sells a platform built on tracking this surface, the window is 23 days in two Western markets, and the method is described clearly enough that another party could try to reproduce it.
Where to go from here
The number worth carrying into your next planning meeting is 1.28%, not 21.6%. A price gap can be argued about, but an overlap that small means the AI surface is a distinct distribution channel with its own inventory, and most merchants are not measuring it at all right now.
A short manual check of your top product queries on both surfaces will tell you more about your exposure than any secondhand statistic. If you would like help setting that check up or reading what it returns, our team is available to talk it through.